OPEN-SOURCE SCRIPT
Güncellendi 🏹 CCI+RSI+EMA Strategy (Enhanced with Oscillator Filters)
This script is a multi-indicator trading strategy that combines trend-following and momentum signals using CCI, RSI, and EMA, enhanced with MACD and Stochastic filters for more reliable entries.
🧠 Core Concept
The strategy aims to:
Identify the trend using EMA(50) and a long-term comparison of EMA 35 vs EMA 169;
Spot momentum using CCI and RSI;
Filter entries through MACD and Stochastic confirmations to avoid false signals.
📌 Buy Conditions:
✅ Price is above EMA
✅ RSI is above a set threshold (default: 45)
✅ CCI is above a set threshold (default: 0)
✅ Uptrend confirmed by EMA 35 > EMA 169
✅ [Enhanced] CCI has recently reached oversold levels (e.g. below -100)
✅ [Enhanced] MACD shows bullish crossover
✅ [Enhanced] Stochastic confirms exit from oversold zone
📌 Sell Conditions:
✅ Price is below EMA
✅ RSI is below a set threshold (default: 55)
✅ CCI is below 0
✅ Downtrend confirmed by EMA 35 < EMA 169
✅ [Enhanced] CCI has recently reached overbought levels (e.g. above 100)
✅ [Enhanced] MACD shows bearish crossover
✅ [Enhanced] Stochastic confirms exit from overbought zone
🎯 Features:
Fully customizable inputs — adapt to your own trading style.
Trend background shading — green for uptrend, red for downtrend.
Enhanced entry logic — filters out weak signals.
CCI Cross and Trigger markers — additional confirmation tools.
🔔 Alerts
You can set alerts for ENHANCED BUY and ENHANCED SELL to never miss a quality signal.
📈 Use Case:
This tool is suitable for:
Manual trading entries and exits
Being a component of a broader trading system
Semi-automation with alert-based strategies
⚠️ Disclaimer:
This script is for educational and testing purposes only. It is not financial advice. Always backtest and demo trade before using on a live account.
Sürüm Notları
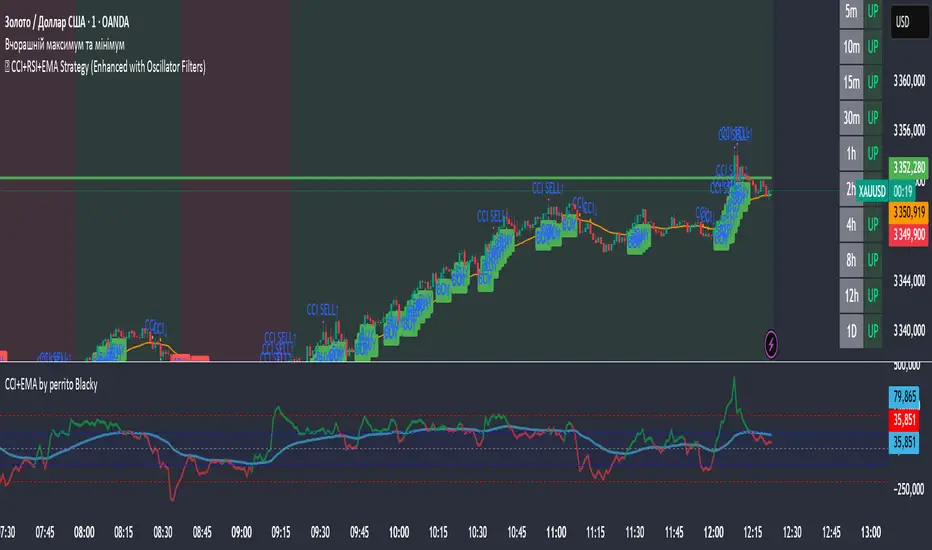
🧭 Multi-Timeframe Trend PanelThis feature adds a compact trend status dashboard in the bottom-right corner of the chart, showing whether the trend is bullish (UP) or bearish (DOWN) across multiple timeframes.
🔍 Logic:
For each timeframe, it compares:
scss
Копіювати
Редагувати
EMA(35) > EMA(169) → UP (bullish)
EMA(35) < EMA(169) → DOWN (bearish)
🕒 Covered Timeframes:
Intraday: 1m, 5m, 10m, 15m, 30m
Hourly: 1h, 2h, 4h, 8h, 12h
Daily: 1D
🎨 Visuals:
Green background = UP trend
Red background = DOWN trend
Neutral gray labels for timeframes
⚠️ Note:
Due to the nature of Pine Script, all timeframe checks are based on the current bar time of the active chart.
This means results may slightly differ when switching between timeframes (e.g. from 5m to 1h), as the underlying time context changes.
Açık kaynak kodlu komut dosyası
Gerçek TradingView ruhuna uygun olarak, bu komut dosyasının oluşturucusu bunu açık kaynaklı hale getirmiştir, böylece yatırımcılar betiğin işlevselliğini inceleyip doğrulayabilir. Yazara saygı! Ücretsiz olarak kullanabilirsiniz, ancak kodu yeniden yayınlamanın Site Kurallarımıza tabi olduğunu unutmayın.
Feragatname
Bilgiler ve yayınlar, TradingView tarafından sağlanan veya onaylanan finansal, yatırım, işlem veya diğer türden tavsiye veya tavsiyeler anlamına gelmez ve teşkil etmez. Kullanım Şartları'nda daha fazlasını okuyun.