PROTECTED SOURCE SCRIPT
AYDINIM
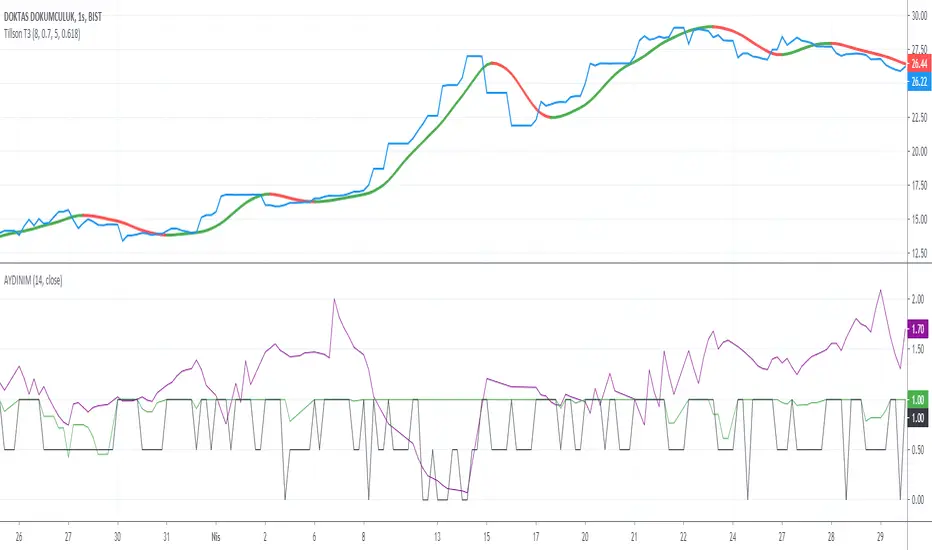
I have prepared this code to better understand the trending starts and sudden ups and downs. Therefore, it uses a unit change function in terms of RSI to visualize the changing points. It is not accurate, but it only provides a means for potential buy and sell points.
This code can be better used in short term tradings. It may not work well in longer term tradings. It has not been tested for variable market conditions yet. Hopefully, when i learn to write a strategy on top of this one, i can manage to test its performance also.
there are 3 output variables. The first one is ema5 which is the 5 day moving average exponential for the unit RSI. The second one is std5 which is the variation in this unit RSI values in 5 days. and the last one is sec variable, which is the selected output function. this so called "sec" can be 0 or 0.5 or 1. A value of 0 means a potentially buy point, whereas a value of 1 means a potentially sell point. and, a value of 0.5 means a constant wait or hold condition.
again, i am not a professional. i just like to play with the numbers and mathematics for trying to ease the selection process for tradings. if you like these new variables, and want to improve the performance, please do not hesitate to contact me.
Korumalı komut dosyası
Bu komut dosyası kapalı kaynak olarak yayınlanmaktadır. Ancak, özgürce ve herhangi bir sınırlama olmaksızın kullanabilirsiniz – daha fazla bilgi burada.
Feragatname
Bilgiler ve yayınlar, TradingView tarafından sağlanan veya onaylanan finansal, yatırım, işlem veya diğer türden tavsiye veya tavsiyeler anlamına gelmez ve teşkil etmez. Kullanım Şartları'nda daha fazlasını okuyun.