PROTECTED SOURCE SCRIPT
Güncellendi Monthly Pattern Analysis (15 Years Historical View)
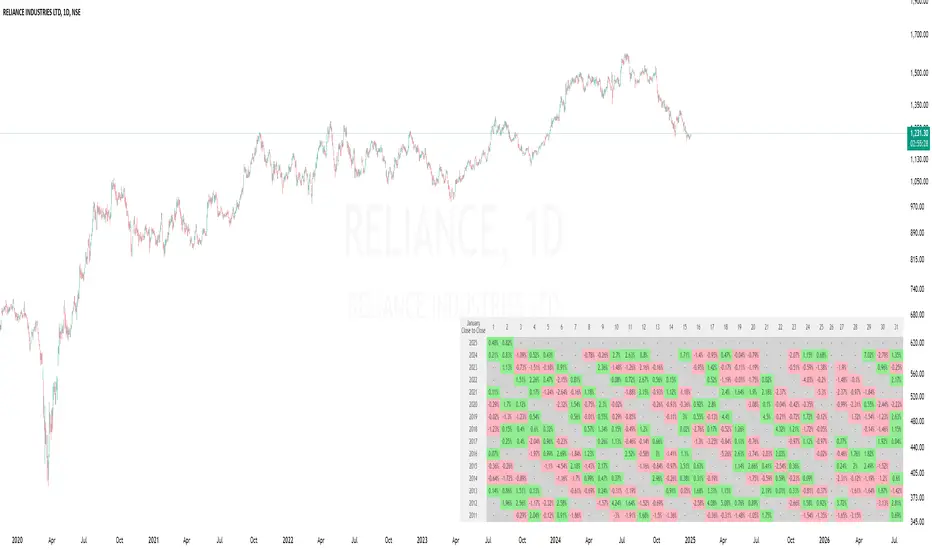
Monthly Pattern Analysis (15 Years Historical View)
This indicator creates a comprehensive visual matrix showing daily percentage changes for any selected month across the last 15 years. Perfect for analyzing historical patterns and seasonality in price movements.
Features:
- Month Selection: Choose any month to analyze (defaults to current month)
- 15-Year History: Shows data from current year back to 15 years
- Flexible Calculations: Choose between "Close to Close" or "Open to Close" percentage changes
- Color-Coded Returns: Green for positive returns, Red for negative returns
- Customizable Display: Adjust table size, position, and colors
- Daily Granularity: Shows changes for each trading day of the selected month
Usage:
1. Apply to any daily chart
2. Select your desired month from settings
3. Choose calculation method (Close-to-Close or Open-to-Close)
4. Customize table appearance as needed
Perfect for:
- Seasonal pattern analysis
- Historical performance comparison
- Month-specific trading strategies
- Long-term market behavior study
Note: Indicator requires Daily timeframe for accurate calculations.
Sürüm Notları
Table size changed to small to display in the available screen size, can be changed to Normal or Large as per the requirement from the Indicator settings.Korumalı komut dosyası
Bu komut dosyası kapalı kaynak olarak yayınlanmaktadır. Ancak, ücretsiz ve herhangi bir sınırlama olmaksızın kullanabilirsiniz – daha fazla bilgiyi buradan edinebilirsiniz.
Feragatname
Bilgiler ve yayınlar, TradingView tarafından sağlanan veya onaylanan finansal, yatırım, alım satım veya diğer türden tavsiye veya öneriler anlamına gelmez ve teşkil etmez. Kullanım Koşulları bölümünde daha fazlasını okuyun.
Korumalı komut dosyası
Bu komut dosyası kapalı kaynak olarak yayınlanmaktadır. Ancak, ücretsiz ve herhangi bir sınırlama olmaksızın kullanabilirsiniz – daha fazla bilgiyi buradan edinebilirsiniz.
Feragatname
Bilgiler ve yayınlar, TradingView tarafından sağlanan veya onaylanan finansal, yatırım, alım satım veya diğer türden tavsiye veya öneriler anlamına gelmez ve teşkil etmez. Kullanım Koşulları bölümünde daha fazlasını okuyun.