OPEN-SOURCE SCRIPT
Previous 5 Day Market Close
This indicator can be used with a strategy known as gap close reversal. Gap close reversal is a trading strategy based on the idea that when a market experiences a gap (a significant difference between the previous day's close and the current day's open), there's a tendency for the price to fill or "close" the gap by moving back to the previous day's closing price. Traders often look for such opportunities as potential entry or exit points.
Here's how you can use this script for gap close reversal trading:
Identify Gaps: Look for instances where the current day's open price significantly deviates from the previous day's close, resulting in a gap on the chart. This could be a gap-up (where the open is higher than the previous close) or a gap-down (where the open is lower than the previous close).
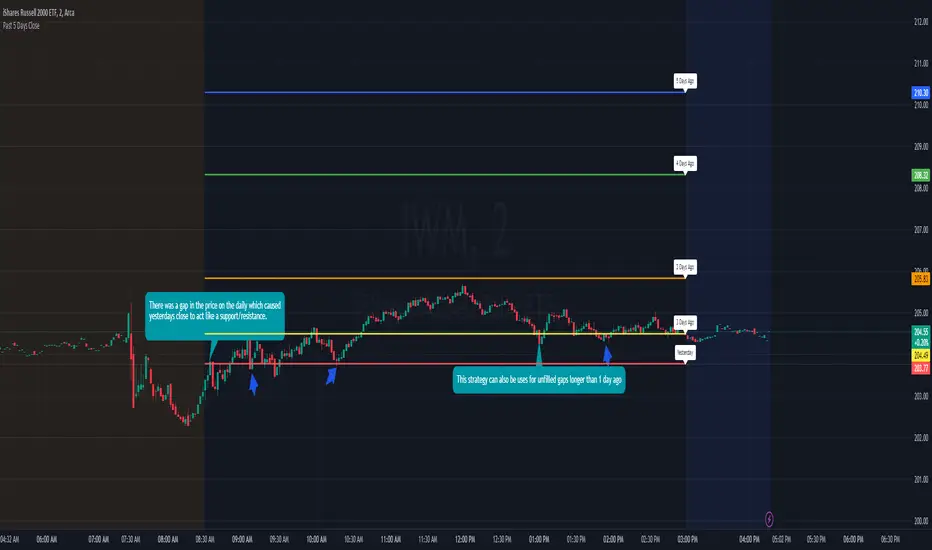
Plot the Script: Apply the "Past 5 Days Close" script to your chart. This will plot the closing prices of the past five trading days as lines on the chart. These lines will serve as reference points for potential gap close levels.
Look for Reversal Signals: Monitor the price action as the market opens and observe how it behaves in relation to the previous day's close and the lines plotted by the script. If the price starts to move towards one of the past closing prices after a gap, it could indicate a potential reversal.
Confirm with Other Indicators: Use additional technical indicators or chart patterns to confirm the potential reversal signal. For example, you might look for bullish or bearish candlestick patterns, support or resistance levels, or momentum indicators aligning with the reversal.
Here's how you can use this script for gap close reversal trading:
Identify Gaps: Look for instances where the current day's open price significantly deviates from the previous day's close, resulting in a gap on the chart. This could be a gap-up (where the open is higher than the previous close) or a gap-down (where the open is lower than the previous close).
Plot the Script: Apply the "Past 5 Days Close" script to your chart. This will plot the closing prices of the past five trading days as lines on the chart. These lines will serve as reference points for potential gap close levels.
Look for Reversal Signals: Monitor the price action as the market opens and observe how it behaves in relation to the previous day's close and the lines plotted by the script. If the price starts to move towards one of the past closing prices after a gap, it could indicate a potential reversal.
Confirm with Other Indicators: Use additional technical indicators or chart patterns to confirm the potential reversal signal. For example, you might look for bullish or bearish candlestick patterns, support or resistance levels, or momentum indicators aligning with the reversal.
Açık kaynak kodlu komut dosyası
Gerçek TradingView ruhuyla, bu komut dosyasının mimarı, yatırımcıların işlevselliğini inceleyip doğrulayabilmesi için onu açık kaynaklı hale getirdi. Yazarı tebrik ederiz! Ücretsiz olarak kullanabilseniz de, kodu yeniden yayınlamanın Topluluk Kurallarımıza tabi olduğunu unutmayın.
Feragatname
Bilgiler ve yayınlar, TradingView tarafından sağlanan veya onaylanan finansal, yatırım, alım satım veya diğer türden tavsiye veya öneriler anlamına gelmez ve teşkil etmez. Kullanım Koşulları bölümünde daha fazlasını okuyun.