OPEN-SOURCE SCRIPT
Rainbow MA Study
I've been interested in 'Multiple Moving Averages' lately and came across another script on here for a Rainbow MA.
Unfortunately its source is private and I wanted to try things out with other MA types so I put this together.
I also wanted to make it a seperate study so I could view regular bars without the clutter.
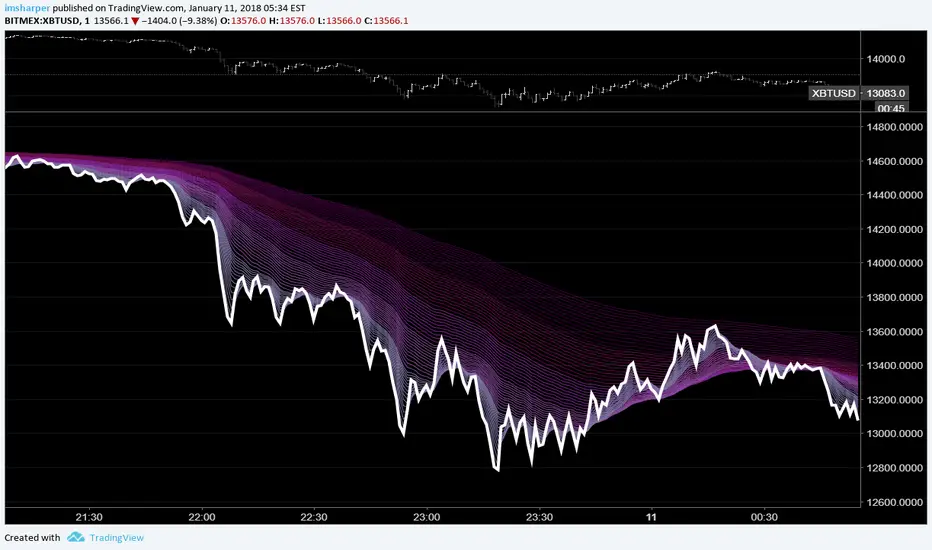
The general rule of thumb with these is the larger the price movement the wider the lines become giving you sort of a wave effect.
When the lines bunch up together you know there's going to be a breakout opportunity that will present itself.
Partly art, partly practical, entirely overkill. Enjoy!
The anchor multiplier should basically allow you to view things in relation to another time period, but it takes forever to load and will likely time out.
Since there are 63 MA's being calculated and plotted changing options on the fly takes some time to process and load.
I'm also pretty new to pine script so it's probably not the best implementation.
MA types: EMA (default), SMA, WMA, VWMA, SMMA, DEMA, TEMA, HullMA, ZEMA, TMA, SSMA
Play around with these to see some different effects.
The white line is the current close price.
Color 1 МАs: 2,3, 4, 5, 6, 7, 8, 9, 10, 11, 12, 13, 14, 15
Color 2 MAs: 17, 19, 21, 23, 25, 27, 29, 31, 33, 35, 37, 39, 41
Color 3 MAs: 44, 47, 50, 53, 56, 59, 62, 65, 68, 71, 74
Color 4 MAs: 78, 82, 86, 90, 94, 98, 102, 106, 110, 114, 118, 122
Color 5 MAs: 126, 131, 137, 143, 149, 155, 155, 161, 167, 173, 179, 185, 191, 197
You can more easily change the colors at the top of this source code instead of one by one in the settings.
If you want this on your main chart instead of a separate window you'll just need to change overlay=true in the study.
References & Thanks:
JustUncleL:
For the timeframe anchor, MA variants, and generally awesome work. This is more practical.
StickyCheeba:
For the idea.
Here's some shots to get an idea of the differences.
HullMA:

VWMA:

SSMA:

TMA:

Unfortunately its source is private and I wanted to try things out with other MA types so I put this together.
I also wanted to make it a seperate study so I could view regular bars without the clutter.
The general rule of thumb with these is the larger the price movement the wider the lines become giving you sort of a wave effect.
When the lines bunch up together you know there's going to be a breakout opportunity that will present itself.
Partly art, partly practical, entirely overkill. Enjoy!
The anchor multiplier should basically allow you to view things in relation to another time period, but it takes forever to load and will likely time out.
Since there are 63 MA's being calculated and plotted changing options on the fly takes some time to process and load.
I'm also pretty new to pine script so it's probably not the best implementation.
MA types: EMA (default), SMA, WMA, VWMA, SMMA, DEMA, TEMA, HullMA, ZEMA, TMA, SSMA
Play around with these to see some different effects.
The white line is the current close price.
Color 1 МАs: 2,3, 4, 5, 6, 7, 8, 9, 10, 11, 12, 13, 14, 15
Color 2 MAs: 17, 19, 21, 23, 25, 27, 29, 31, 33, 35, 37, 39, 41
Color 3 MAs: 44, 47, 50, 53, 56, 59, 62, 65, 68, 71, 74
Color 4 MAs: 78, 82, 86, 90, 94, 98, 102, 106, 110, 114, 118, 122
Color 5 MAs: 126, 131, 137, 143, 149, 155, 155, 161, 167, 173, 179, 185, 191, 197
You can more easily change the colors at the top of this source code instead of one by one in the settings.
If you want this on your main chart instead of a separate window you'll just need to change overlay=true in the study.
References & Thanks:
JustUncleL:
For the timeframe anchor, MA variants, and generally awesome work. This is more practical.
StickyCheeba:
For the idea.
Here's some shots to get an idea of the differences.
HullMA:
VWMA:
SSMA:
TMA:
Açık kaynak kodlu komut dosyası
Gerçek TradingView ruhuna uygun olarak, bu komut dosyasının oluşturucusu bunu açık kaynaklı hale getirmiştir, böylece yatırımcılar betiğin işlevselliğini inceleyip doğrulayabilir. Yazara saygı! Ücretsiz olarak kullanabilirsiniz, ancak kodu yeniden yayınlamanın Site Kurallarımıza tabi olduğunu unutmayın.
Feragatname
Bilgiler ve yayınlar, TradingView tarafından sağlanan veya onaylanan finansal, yatırım, işlem veya diğer türden tavsiye veya tavsiyeler anlamına gelmez ve teşkil etmez. Kullanım Şartları'nda daha fazlasını okuyun.