OPEN-SOURCE SCRIPT
EMA Channel Key K-Lines
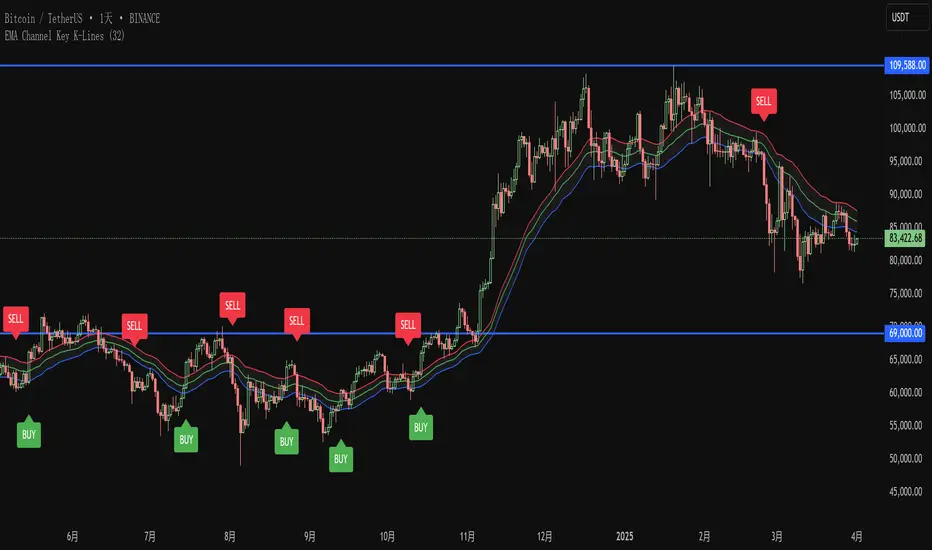
EMA Channel Setup:
Key K-line Identification:
Visual Markers:
Logic Flow:
- Three 32-period EMAs (high, low, close prices)
- Visually distinct colors (red, blue, green)
- Gray background between high and low EMAs
Key K-line Identification:
- For buy signals: Close > highest EMA, K-line height ≥ channel height, body ≥ 2/3 of range
- For sell signals: Close < lowest EMA, K-line height ≥ channel height, body ≥ 2/3 of range
- Alternating signals only (no consecutive buy/sell signals)
Visual Markers:
- Green "BUY" labels below key buy K-lines
- Red "SELL" labels above key sell K-lines
- Clear channel visualization
Logic Flow:
- Tracks last signal direction to prevent consecutive same-type signals
- Strict conditions ensure only significant breakouts are marked
- All calculations based on your exact specifications
Açık kaynak kodlu komut dosyası
Gerçek TradingView ruhuyla, bu komut dosyasının mimarı, yatırımcıların işlevselliğini inceleyip doğrulayabilmesi için onu açık kaynaklı hale getirdi. Yazarı tebrik ederiz! Ücretsiz olarak kullanabilseniz de, kodu yeniden yayınlamanın Topluluk Kurallarımıza tabi olduğunu unutmayın.
Feragatname
Bilgiler ve yayınlar, TradingView tarafından sağlanan veya onaylanan finansal, yatırım, alım satım veya diğer türden tavsiye veya öneriler anlamına gelmez ve teşkil etmez. Kullanım Koşulları bölümünde daha fazlasını okuyun.