OPEN-SOURCE SCRIPT
Güncellendi Information Theory Market Analysis
INFORMATION THEORY MARKET ANALYSIS
OVERVIEW
This indicator applies mathematical concepts from information theory to analyze market behavior, measuring the randomness and predictability of price and volume movements through entropy calculations. Unlike traditional technical indicators, it provides insight into market structure and regime changes.
KEY COMPONENTS
Four Main Signals:
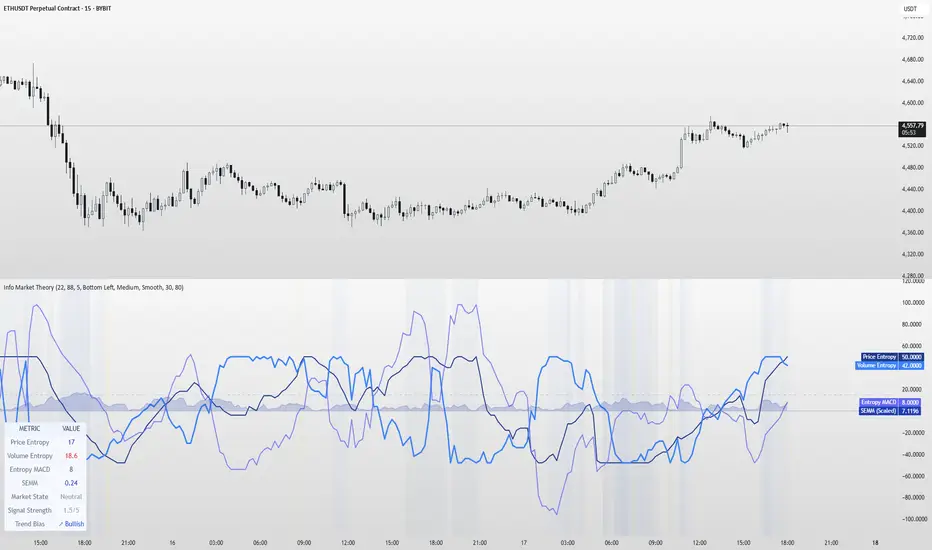
• Price Entropy (Deep Blue): Measures randomness in price movements
• Volume Entropy (Bright Blue): Analyzes volume pattern predictability
• Entropy MACD (Purple): Shows relationship between price and volume entropy
• SEMM (Royal Blue): Stochastic Entropy Market Monitor - overall market randomness gauge
Market State Detection:
The indicator identifies seven distinct market states:
• Strong Trending (SEMM < 0.1)
• Weak Trending (0.1-0.2)
• Neutral (0.2-0.3)
• Moderate Random (0.3-0.5)
• High Randomness (0.5-0.8)
• Very Random (0.8-1.0)
• Chaotic (>1.0)
KEY FEATURES
Advanced Analytics:
• Signal Strength Confluence: 0-5 scale measuring alignment of multiple factors
• Entropy Crossovers: Detects shifts between accumulation and distribution phases
• Extreme Readings: Identifies statistical outliers for potential reversals
• Trend Bias Analysis: Directional momentum assessment
Information Dashboard:
• Real-time entropy values and market state
• Signal strength indicator with visual highlighting
• Trend bias with directional arrows
• Color-coded alerts for extreme conditions
Customizable Display:
• Adjustable SEMM scaling (5x to 100x) for optimal visibility
• Multiple line styles: Smooth, Stepped, Dotted
• 9 table positions with 3 size options
• Professional blue color scheme with transparency controls
Comprehensive Alert System - 15 Alert Types Including:
• Extreme entropy readings (price/volume)
• Crossover signals (dominance shifts)
• Market state changes (trending ↔ random)
• High confluence signals (3+ factors aligned)
HOW TO USE
Reading the Signals:
• Entropy Values > ±25: Strong structural signals
• Entropy Values > ±40: Extreme readings, potential reversals
• SEMM < 0.2: Trending market favors directional strategies
• SEMM > 0.5: Random market favors range/scalping strategies
Signal Confluence:
Look for multiple factors aligning:
• Signal Strength ≥ 3.0 for higher probability setups
• Background highlighting indicates confluence
• Table shows real-time strength assessment
Timeframe Optimization:
• Short-term (1m-15m): Entropy Length 14-22, Sensitivity 3-5
• Swing Trading (1H-4H): Default settings optimal
• Position Trading (Daily+): Entropy Length 34-55, Sensitivity 8-12
EDUCATIONAL APPLICATIONS
Market Structure Analysis:
• Understand when markets are trending vs. ranging
• Identify accumulation and distribution phases
• Recognize extreme market conditions
• Measure information content in price movements
Information Theory Concepts:
• Binary entropy calculations applied to financial data
• Probability distribution analysis of returns
• Statistical ranking and percentile analysis
• Momentum-adjusted randomness measurement
TECHNICAL DETAILS
Calculations:
• Uses binary entropy formula: -[p×log₂(p) + (1-p)×log₂(1-p)]
• Percentile ranking across multiple timeframes
• Volume-weighted probability distributions
• RSI-adjusted momentum entropy (SEMM)
Customization Options:
• Entropy Length: 5-100 bars (default: 22)
• Average Length: 10-200 bars (default: 88)
• Sensitivity: 1.0-20.0 (default: 5.0, lower = more sensitive)
• SEMM Scaling: 5.0-100.0x (default: 30.0)
IMPORTANT NOTES
Risk Considerations:
• Indicator measures probabilities, not certainties
• High SEMM values (>0.5) suggest increased market randomness
• Extreme readings may persist longer than expected
• Always combine with proper risk management
Educational Purpose:
This indicator is designed for:
• Market structure analysis and education
• Understanding information theory applications in finance
• Developing probabilistic thinking about markets
• Research and analytical purposes
Performance Tips:
• Allow 200+ bars for proper initialization
• Adjust scaling and transparency for optimal visibility
• Use confluence signals for higher probability analysis
• Consider multiple timeframes for comprehensive analysis
DISCLAIMER
This indicator is for educational and analytical purposes. It does not constitute financial advice. Past performance does not guarantee future results. Always conduct your own research and consider your risk tolerance before making trading decisions.
Version: 5.0
Category: Oscillators, Volume, Market Structure
Best For: All timeframes, trending and ranging markets
Complexity: Intermediate to Advanced
OVERVIEW
This indicator applies mathematical concepts from information theory to analyze market behavior, measuring the randomness and predictability of price and volume movements through entropy calculations. Unlike traditional technical indicators, it provides insight into market structure and regime changes.
KEY COMPONENTS
Four Main Signals:
• Price Entropy (Deep Blue): Measures randomness in price movements
• Volume Entropy (Bright Blue): Analyzes volume pattern predictability
• Entropy MACD (Purple): Shows relationship between price and volume entropy
• SEMM (Royal Blue): Stochastic Entropy Market Monitor - overall market randomness gauge
Market State Detection:
The indicator identifies seven distinct market states:
• Strong Trending (SEMM < 0.1)
• Weak Trending (0.1-0.2)
• Neutral (0.2-0.3)
• Moderate Random (0.3-0.5)
• High Randomness (0.5-0.8)
• Very Random (0.8-1.0)
• Chaotic (>1.0)
KEY FEATURES
Advanced Analytics:
• Signal Strength Confluence: 0-5 scale measuring alignment of multiple factors
• Entropy Crossovers: Detects shifts between accumulation and distribution phases
• Extreme Readings: Identifies statistical outliers for potential reversals
• Trend Bias Analysis: Directional momentum assessment
Information Dashboard:
• Real-time entropy values and market state
• Signal strength indicator with visual highlighting
• Trend bias with directional arrows
• Color-coded alerts for extreme conditions
Customizable Display:
• Adjustable SEMM scaling (5x to 100x) for optimal visibility
• Multiple line styles: Smooth, Stepped, Dotted
• 9 table positions with 3 size options
• Professional blue color scheme with transparency controls
Comprehensive Alert System - 15 Alert Types Including:
• Extreme entropy readings (price/volume)
• Crossover signals (dominance shifts)
• Market state changes (trending ↔ random)
• High confluence signals (3+ factors aligned)
HOW TO USE
Reading the Signals:
• Entropy Values > ±25: Strong structural signals
• Entropy Values > ±40: Extreme readings, potential reversals
• SEMM < 0.2: Trending market favors directional strategies
• SEMM > 0.5: Random market favors range/scalping strategies
Signal Confluence:
Look for multiple factors aligning:
• Signal Strength ≥ 3.0 for higher probability setups
• Background highlighting indicates confluence
• Table shows real-time strength assessment
Timeframe Optimization:
• Short-term (1m-15m): Entropy Length 14-22, Sensitivity 3-5
• Swing Trading (1H-4H): Default settings optimal
• Position Trading (Daily+): Entropy Length 34-55, Sensitivity 8-12
EDUCATIONAL APPLICATIONS
Market Structure Analysis:
• Understand when markets are trending vs. ranging
• Identify accumulation and distribution phases
• Recognize extreme market conditions
• Measure information content in price movements
Information Theory Concepts:
• Binary entropy calculations applied to financial data
• Probability distribution analysis of returns
• Statistical ranking and percentile analysis
• Momentum-adjusted randomness measurement
TECHNICAL DETAILS
Calculations:
• Uses binary entropy formula: -[p×log₂(p) + (1-p)×log₂(1-p)]
• Percentile ranking across multiple timeframes
• Volume-weighted probability distributions
• RSI-adjusted momentum entropy (SEMM)
Customization Options:
• Entropy Length: 5-100 bars (default: 22)
• Average Length: 10-200 bars (default: 88)
• Sensitivity: 1.0-20.0 (default: 5.0, lower = more sensitive)
• SEMM Scaling: 5.0-100.0x (default: 30.0)
IMPORTANT NOTES
Risk Considerations:
• Indicator measures probabilities, not certainties
• High SEMM values (>0.5) suggest increased market randomness
• Extreme readings may persist longer than expected
• Always combine with proper risk management
Educational Purpose:
This indicator is designed for:
• Market structure analysis and education
• Understanding information theory applications in finance
• Developing probabilistic thinking about markets
• Research and analytical purposes
Performance Tips:
• Allow 200+ bars for proper initialization
• Adjust scaling and transparency for optimal visibility
• Use confluence signals for higher probability analysis
• Consider multiple timeframes for comprehensive analysis
DISCLAIMER
This indicator is for educational and analytical purposes. It does not constitute financial advice. Past performance does not guarantee future results. Always conduct your own research and consider your risk tolerance before making trading decisions.
Version: 5.0
Category: Oscillators, Volume, Market Structure
Best For: All timeframes, trending and ranging markets
Complexity: Intermediate to Advanced
Sürüm Notları
Information Theory Market AnalysisOverview:
This indicator calculates entropy-based measures using price and volume data to create oscillating signals. The calculations apply binary entropy formulas to ranked price movements and volume patterns, producing multiple oscillators that attempt to quantify randomness in market data.
Technical Components:
Primary Calculations:
Price Entropy: Binary entropy calculation applied to ranked price changes over a specified period
Volume Entropy: Binary entropy calculation applied to volume distribution patterns
Entropy MACD: Moving average convergence/divergence of the entropy calculations
SEMM (Stochastic Entropy Market Monitor): RSI-adjusted entropy measurement scaled for visualization
Mathematical Methodology:
Uses binary entropy formula: -[p×log₂(p) + (1-p)×log₂(1-p)]
Applies percentile ranking to price and volume data
Calculates probability distributions based on historical patterns
Normalizes results to create oscillating signals
Parameters:
Entropy Length: Number of bars used for entropy calculations (5-100, default: 22)
Average Length: Period for moving average smoothing (10-200, default: 88)
Sensitivity: Scaling factor for signal amplitude (1.0-20.0, default: 5.0)
SEMM Scaling: Multiplier for SEMM visualization (5.0-100.0x, default: 30.0)
Display Features:
Four oscillating lines representing different entropy measurements
Information table showing current values and calculated market states
Background highlighting based on signal confluence
Customizable scaling and visual elements
Market State Classifications:
The indicator categorizes market conditions based on SEMM values:
Strong Trending (< 0.1)
Weak Trending (0.1-0.2)
Neutral (0.2-0.3)
Moderate Random (0.3-0.5)
High Randomness (0.5-0.8)
Very Random (0.8-1.0)
Chaotic (>1.0)
Important Limitations:
Entropy calculations are based on historical data and provide no predictive capability
Binary entropy applied to financial data does not constitute comprehensive information theory analysis
Market state classifications are subjective interpretations of calculated values
High entropy readings do not necessarily indicate trading opportunities
All signals are lagging indicators derived from past price and volume data
Technical Considerations:
Requires significant historical data (200+ bars) for stable calculations
Entropy values are relative to the specified lookback period and sensitivity settings
Market state boundaries are arbitrary thresholds rather than mathematically derived levels
Signal confluence does not improve predictive accuracy
Critical Warnings:
This indicator does not predict future price movements or market behavior
Entropy measurements do not guarantee the identification of market structure changes
High or low entropy readings may persist for extended periods
Should not be used as a standalone trading system
Past signal performance provides no indication of future effectiveness
Educational Note:
While this indicator applies mathematical concepts from information theory, the financial market applications represent simplified implementations rather than comprehensive information-theoretic analysis. Users should understand the distinction between mathematical entropy calculations and their practical utility in market analysis.
Disclaimer:
This indicator is intended for educational and analytical purposes. It does not constitute financial advice or trading recommendations. All calculations are based on historical data and cannot predict future market movements.
Açık kaynak kodlu komut dosyası
Gerçek TradingView ruhuyla, bu komut dosyasının mimarı, yatırımcıların işlevselliğini inceleyip doğrulayabilmesi için onu açık kaynaklı hale getirdi. Yazarı tebrik ederiz! Ücretsiz olarak kullanabilseniz de, kodu yeniden yayınlamanın Topluluk Kurallarımıza tabi olduğunu unutmayın.
Feragatname
Bilgiler ve yayınlar, TradingView tarafından sağlanan veya onaylanan finansal, yatırım, alım satım veya diğer türden tavsiye veya öneriler anlamına gelmez ve teşkil etmez. Kullanım Koşulları bölümünde daha fazlasını okuyun.