Universal Valuation | QuantMAC
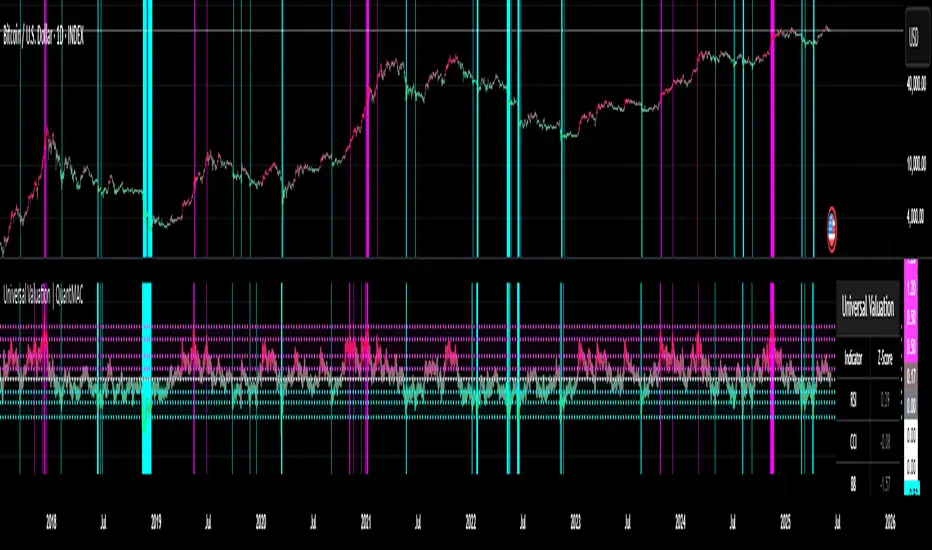
🚀 Professional-Grade Valuation Engine with 14+ Technical Components
The Universal Valuation indicator is a sophisticated composite analysis tool that combines multiple technical indicators, statistical measures, and risk ratios to provide a comprehensive assessment of asset valuation across all market conditions and timeframes.
📊 Core Architecture & Methodology
🔬 Z-Score Normalization System
Each component is normalized using statistical Z-scores, which measure how many standard deviations a value is from its historical mean. This standardization allows different indicators to be combined meaningfully:
- Positive Z-scores indicate values above historical average (potentially overvalued)
- Negative Z-scores indicate values below historical average (potentially undervalued)
- Individual lookback periods for each component ensure optimal sensitivity
- Real-time statistical calculations with dynamic standard deviation adjustments
📈 Composite Scoring Algorithm
The final valuation score is calculated as the weighted average of all enabled components, providing a unified view of market conditions while maintaining granular control over individual inputs.
🛠️ Technical Components Breakdown
📊 Momentum & Oscillator Components
🎯 RSI (Relative Strength Index)
- Function: Measures price momentum and overbought/oversold conditions
- Default Settings: 21-period RSI with 150-period Z-score normalization
- Analysis: Values above 70 (traditional) become positive Z-scores, indicating potential overvaluation
- Edge: Z-score normalization adapts to changing market volatility unlike fixed thresholds
🌊 CCI (Commodity Channel Index)
- Function: Identifies cyclical price patterns and extreme price levels
- Default Settings: 30-period CCI with 150-period Z-score normalization
- Analysis: Measures price deviation from statistical mean using typical price (HLC/3)
- Edge: Excellent for identifying price extremes in trending and ranging markets
🔵 Chande Momentum Oscillator
- Function: Advanced momentum indicator using sum of gains vs. sum of losses
- Default Settings: 50-period calculation with 50-period Z-score normalization
- Analysis: Formula: 100 * (Sum_Gains - Sum_Losses) / (Sum_Gains + Sum_Losses)
- Edge: Less prone to whipsaws compared to RSI, better momentum persistence detection
🎭 IMI (Intraday Momentum Index)
- Function: Combines RSI concept with intraday price action analysis
- Default Settings: 100-period calculation with 150-period Z-score normalization
- Analysis: Uses gains/losses based on close vs. open rather than close-to-close
- Edge: Captures intraday sentiment and gap behavior effectively
📈 Price Action & Trend Components
📊 Bollinger Bands Position
- Function: Measures price position relative to volatility-adjusted bands
- Default Settings: 30-period bands with 50-period Z-score normalization
- Analysis: (Price - SMA) / (2 * Standard_Deviation) normalized to Z-score
- Edge: Adapts to volatility changes, providing context-aware overbought/oversold levels
💹 Price Z-Score
- Function: Direct statistical analysis of price deviation from historical mean
- Default Settings: 150-period lookback for Z-score calculation
- Analysis: Pure price momentum without indicator lag or smoothing
- Edge: Unfiltered price analysis, excellent for mean reversion strategies
📊 Disparity Index
- Function: Measures percentage deviation of price from its moving average
- Default Settings: 10-period SMA with 150-period Z-score normalization
- Analysis: 100 * (Price - SMA) / SMA, then normalized to Z-score
- Edge: Highly sensitive to short-term price deviations, excellent for timing entries
🎯 TEMA (Triple Exponential Moving Average)
- Function: Advanced moving average with reduced lag and improved responsiveness
- Default Settings: 10-period TEMA with 150-period Z-score normalization
- Analysis: Triple-smoothed EMA that maintains trend-following capability with less noise
- Edge: Superior trend identification with minimal lag compared to traditional MAs
📊 Volume & Market Structure Components
📈 VWAP (Volume Weighted Average Price)
- Function: Incorporates volume into price analysis for institutional perspective
- Default Settings: Standard VWAP with 300-period Z-score normalization
- Analysis: Compares current price to volume-weighted institutional benchmark
- Edge: Reveals institutional sentiment and identifies fair value zones
⚡ Intraday Momentum
- Function: Measures session-based momentum using open-to-close movement
- Default Settings: (Close - Open) / Open * 100 with 250-period Z-score normalization
- Analysis: Captures daily sentiment and gap behavior in percentage terms
- Edge: Excellent for intraday trading and gap analysis strategies
🎲 Advanced Statistical Components
🌊 Hurst Exponent (Optional)
- Function: Measures market efficiency and trend persistence characteristics
- Default Settings: 100-period calculation with 200-period Z-score normalization
- Analysis: Values > 0.5 indicate trending markets, < 0.5 indicate mean-reverting markets
- Edge: Identifies market regime changes and optimal strategy selection
- Note: Computationally intensive, disabled by default for performance
📊 Risk-Adjusted Performance Ratios
⚡ Sharpe Ratio
- Function: Risk-adjusted return measurement using total volatility
- Default Settings: 400-period calculation with 120-period Z-score normalization
- Analysis: (Return - Risk_Free_Rate) / Standard_Deviation of returns
- Edge: Identifies periods of superior risk-adjusted performance
🎯 Sortino Ratio
- Function: Risk-adjusted return using only downside deviation (superior to Sharpe)
- Default Settings: 400-period calculation with 120-period Z-score normalization
- Analysis: (Return - Risk_Free_Rate) / Downside_Deviation
- Edge: More accurate risk assessment as it ignores upside volatility
🌟 Omega Ratio
- Function: Advanced risk measure comparing gains above threshold to losses below
- Default Settings: 400-period calculation with 200-period Z-score normalization
- Analysis: Sum_of_Gains_Above_Threshold / Sum_of_Losses_Below_Threshold
- Edge: Captures full return distribution, not just mean and variance
🎨 Visualization & Interface
🌈 Dual Color Schemes
- Bright Mode: Vibrant colors for clear daylight visibility
- Dark Mode: Muted tones for low-light trading environments
- Adaptive Gradients: Color intensity scales with Z-score magnitude
- Background Highlighting: Optional panel and chart background coloring for extreme conditions
📊 Comprehensive Data Table
- Real-time Z-scores for each enabled component
- Composite score with gradient coloring
- Valuation phase classification (6 distinct levels)
- Toggle individual components on/off for custom analysis
🎯 Valuation Phase Classifications
📈 Systematic Valuation Levels
- Extremely Undervalued: Z-score ≤ -2.0 (Exceptional buying opportunity)
- Strongly Undervalued: Z-score ≤ -1.3 (Strong buying signal)
- Moderately Undervalued: Z-score < -0.65 (Potential buying opportunity)
- Fairly Valued: Z-score -0.65 to 0.5 (Neutral zone)
- Slightly Overvalued: Z-score 0.5 to 1.2 (Caution zone)
- Moderately Overvalued: Z-score 1.2 to 2.0 (Potential selling zone)
- Strongly Overvalued: Z-score ≥ 2.0 (Strong selling signal)
🌍 Universal Asset Compatibility
✅ Equity Markets - Individual stocks, ETFs, indices, sector rotation analysis
✅ Cryptocurrency - Bitcoin, altcoins, DeFi tokens, NFT projects
8H
12H
4H
🚀 Key Strategic Advantages
🔬 Scientific Approach
Unlike traditional indicators that use fixed thresholds, the Universal Valuation employs dynamic statistical normalization that adapts to changing market conditions and volatility regimes.
⚡ Multi-Dimensional Analysis
Combines momentum, trend, volume, and risk-adjusted metrics to provide a 360-degree view of market valuation, reducing false signals and improving decision accuracy.
🎯 Customizable Framework
Enable or disable individual components to create custom valuation models tailored to specific assets, strategies, or market conditions.
📊 Institutional-Grade Metrics
Incorporates sophisticated risk ratios (Sharpe, Sortino, Omega) typically used by hedge funds and institutional investors.
💡 Professional Trading Applications
🎯 Mean Reversion Strategies
- Identify extreme valuation levels for contrarian entries
- Use composite Z-score thresholds for systematic signal generation
- Combine with volume analysis for confirmation
📈 Trend Following Enhancement
- Avoid trend entries during overvalued conditions
- Use undervalued readings to add to existing positions
- Time trend continuation trades with valuation support
🔄 Portfolio Management
- Asset allocation based on relative valuation scores
- Risk management using integrated Sharpe/Sortino ratios
- Sector rotation timing using cross-asset comparison
⚡High-Frequency Applications
- Intraday momentum component for scalping strategies
- VWAP analysis for institutional order flow
- Real-time composite scoring for algorithmic systems
🛠️ Configuration Best Practices
📊 Conservative Setup (Long-term)
- Enable all components except Hurst Exponent
- Use longer Z-score periods (200+) for stability
- Focus on -1.3/+2.0 thresholds for major signals
⚡ Aggressive Setup (Short-term)
- Emphasize momentum components (RSI, CCI, Chande)
- Shorter Z-score periods (50-100) for responsiveness
- Use -0.65/+1.2 thresholds for frequent signals
🎯 Risk-Focused Setup
- Prioritize Sharpe, Sortino, and Omega ratios
- Enable VWAP and price components
- Use conservative thresholds with position sizing guidance
---
🏆 Professional Multi-Asset Valuation System
The Universal Valuation indicator represents a quantum leap in technical analysis sophistication, combining academic rigor with practical trading applications. By normalizing diverse technical components through statistical Z-scores, it provides objective, data-driven valuation assessments that adapt to any market condition.
---
📝 Disclaimer: This indicator is for educational and informational purposes only. The statistical models and risk ratios do not guarantee future performance. Always conduct thorough analysis and implement proper risk management practices.
Yalnızca davetli komut dosyası
Bu komut dosyasına yalnızca yazar tarafından onaylanan kullanıcılar erişebilir. Kullanmak için izin istemeniz ve almanız gerekir. Bu genellikle ödeme yapıldıktan sonra verilir. Daha fazla ayrıntı için aşağıdaki yazarın talimatlarını izleyin veya doğrudan Quant_MAC ile iletişime geçin.
TradingView, yazarına tamamen güvenmediğiniz ve nasıl çalıştığını anlamadığınız sürece bir komut dosyası için ödeme yapmanızı veya kullanmanızı TAVSİYE ETMEZ. Ayrıca topluluk komut dosyalarımızda ücretsiz, açık kaynaklı alternatifler bulabilirsiniz.
Yazarın talimatları
Feragatname
Yalnızca davetli komut dosyası
Bu komut dosyasına yalnızca yazar tarafından onaylanan kullanıcılar erişebilir. Kullanmak için izin istemeniz ve almanız gerekir. Bu genellikle ödeme yapıldıktan sonra verilir. Daha fazla ayrıntı için aşağıdaki yazarın talimatlarını izleyin veya doğrudan Quant_MAC ile iletişime geçin.
TradingView, yazarına tamamen güvenmediğiniz ve nasıl çalıştığını anlamadığınız sürece bir komut dosyası için ödeme yapmanızı veya kullanmanızı TAVSİYE ETMEZ. Ayrıca topluluk komut dosyalarımızda ücretsiz, açık kaynaklı alternatifler bulabilirsiniz.