PROTECTED SOURCE SCRIPT
Güncellendi Fadi ffa
**Fadi Dynamic Trend Indicator**
The **Fadi Dynamic Trend Indicator** is a comprehensive technical analysis tool designed to assist traders in identifying trends, key price levels, and potential reversal points across various markets and timeframes. By combining dynamic trend detection, statistical price channel analysis, and advanced reversal point identification, this indicator provides actionable insights for trend-following, breakout, and reversal trading strategies.
**How It Works**:
This indicator integrates three complementary components to deliver clear trading signals and a deeper understanding of market dynamics:
1. **Dynamic Trend Detection**: Utilizes a proprietary algorithm based on the Average True Range (ATR) to calculate dynamic support and resistance levels. It generates Buy and Sell signals when the price crosses these levels, indicating potential trend changes. Traders can customize the trend strength and sensitivity to suit their trading style.
2. **Price Channel Analysis**: Plots a statistical channel based on price regression, highlighting the trend's direction and range. The channel dynamically extends to the right, helping traders identify breakout zones and trend continuation patterns.
3. **Reversal Point Detection**: Identifies significant high and low points in the market, marking them with triangle symbols (▼ for highs, ▲ for lows). Additionally, it highlights "missed" reversal levels (also marked with ▼ and ▲) to indicate potential price zones that have not yet been tested, offering unique insights into untapped market opportunities.
**How to Use**:
- **Timeframes**: The indicator performs well on various timeframes, with optimal results on 15-minute to 1-hour charts for scalping or swing trading.
- **Signals**: Look for Buy (green "BUY" label below the bar) and Sell (red "SELL" label above the bar) signals to enter trades, ideally confirmed by price action within the price channel or near reversal points.
- **Reversal Points**: Monitor the ▼ (highs) and ▲ (lows) labels to identify key reversal zones. The "missed" levels (also shown as ▼ and ▲) indicate potential areas where the price may react in the future.
- **Customization**:
- **Trend Signal Strength** (default: 1): Adjusts the ATR period to control the frequency of trend signals.
- **Trend Sensitivity** (default: 0.8): Fine-tunes the responsiveness of the trend lines.
- **Reversal Signal Sensitivity** (default: 7): Defines the lookback period for detecting reversal points.
- **Price Channel Length** (default: 100): Sets the period for calculating the price channel.
- Use the indicator on standard candlestick charts for accurate results.
**Unique Features**:
- **Integrated Analysis**: Combines trend detection, price channel analysis, and reversal point identification into a single, cohesive tool.
- **Missed Reversal Levels**: Highlights untested price levels with ▼ and ▲ symbols, helping traders anticipate potential price reactions before they occur.
- **Dynamic Customization**: Offers adjustable settings to adapt the indicator to different markets (stocks, forex, crypto) and trading strategies (scalping, day trading, or swing trading).
- **Efficient Design**: Optimized to minimize resource usage, ensuring smooth performance on TradingView charts.
**Settings**:
- **Trend Signal Strength**: Controls the ATR period for trend calculations (default: 1).
- **Trend Sensitivity**: Adjusts the sensitivity of trend signals (default: 0.8).
- **Reversal Signal Sensitivity**: Defines the lookback period for reversal point detection (default: 7).
- **Price Channel Length**: Sets the period for the statistical price channel (default: 100).
**Trading Tips**:
- For scalping, use shorter timeframes (5-15 minutes) and increase the Trend Sensitivity for more frequent signals.
- For swing trading, use higher timeframes (1-hour or 4-hour) and adjust the Reversal Signal Sensitivity to focus on significant reversal points.
- Combine Buy/Sell signals with price channel breakouts or interactions with reversal levels for higher-probability trades.
- Monitor the correlation coefficient (displayed below the chart) to gauge the strength of the trend within the price channel.
**Why Use This Indicator?**
The Fadi Dynamic Trend Indicator is ideal for traders seeking a versatile tool that simplifies complex market analysis. Its unique combination of trend signals, price channel visualization, and missed reversal levels empowers traders to make informed decisions in trending or ranging markets. Whether you're a beginner or an experienced trader, this indicator provides clear, actionable insights to enhance your trading strategy.
**Note**: This indicator is designed for use on standard candlestick charts to ensure realistic and reliable results. Always backtest and validate the indicator on your preferred market and timeframe before using it in live trading.
Sürüm Notları
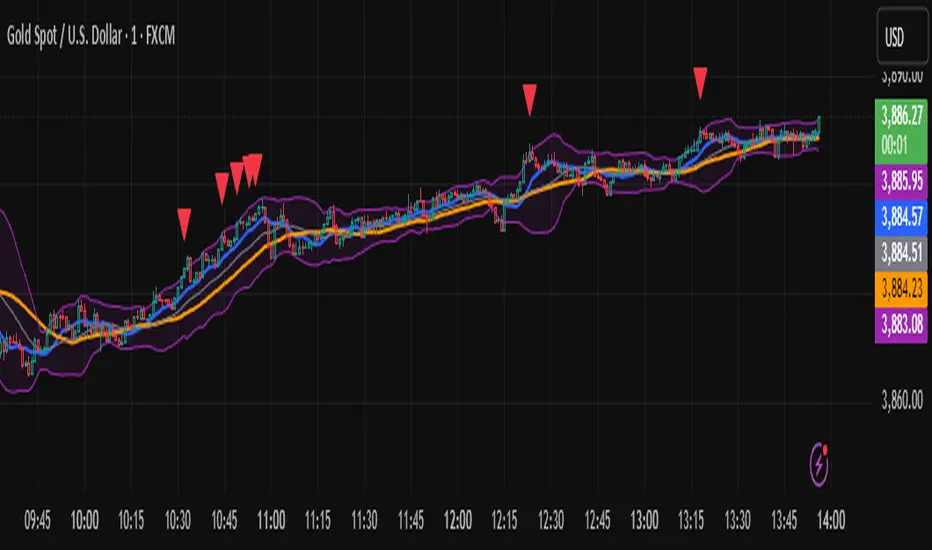
**Fadi Dynamic Trend Indicator (FDTI) - Version 2.0: Enhanced Dynamic Trend Analysis** We are pleased to introduce Version 2.0 of the Fadi Dynamic Trend Indicator (FDTI), representing a significant leap forward in trend analysis and the identification of potential reversal points in financial markets. This indicator has been completely redesigned to provide more dynamic and flexible insights, while maintaining its core objective of assisting traders in making informed decisions. **What's New in Version 2.0?** 1. **Advanced Dynamic Trend Detection System:** * Instead of relying on direct buy and sell signals, the new version offers a visual system for trend identification through **direct candlestick coloring on the chart**. Candlesticks are colored green to indicate a strong uptrend, red for a downtrend, and gray for neutral or sideways periods. This system is based on dynamic crossovers between two customizable moving averages (fast and slow), providing immediate and clear visibility into buyer or seller dominance. 2. **Enhanced Dynamic Price Channel:** * The static price channel concept from previous versions has been replaced with **Bollinger Bands**. This dynamic channel provides a price range that automatically adapts to market volatility, expanding during periods of high volatility and contracting during calmer phases. This allows traders to identify dynamic support and resistance levels more effectively, as well as monitor relative overbought and oversold conditions within the channel. 3. **Precise Potential Reversal Point Identification:** * To enhance the indicator's ability to identify reversal points, the **Relative Strength Index (RSI)** has been integrated. The indicator now displays clear visual signals (small triangles below or above candlesticks) when the price reaches overbought or oversold regions according to the RSI. These signals serve as early warnings for potential trend changes, giving traders an opportunity to assess the situation before making decisions. 4. **Greater Flexibility and Customization:** * The indicator's inputs have been improved to provide greater user control. You can now adjust the lengths of the moving averages, Bollinger Bands settings (length and standard deviation), and RSI overbought/oversold levels, allowing you to tailor the indicator to suit your trading style and any currency pair or financial asset. **How FDTI 2.0 Helps You:** * **Instant Trend Overview:** Candlestick coloring provides a quick glance at the prevailing trend. * **Identify Trading Zones:** The dynamic price channel helps define potential trading ranges. * **Early Warnings:** RSI reversal signals alert you to potential market shifts. * **Improved Trading Decisions:** By integrating these features, FDTI 2.0 aims to provide you with a comprehensive tool for market analysis and enhance the accuracy of your decisions.We believe this update will add significant value to your trading experience and help you navigate the markets with greater confidence.Korumalı komut dosyası
Bu komut dosyası kapalı kaynak olarak yayınlanmaktadır. Ancak, ücretsiz ve herhangi bir sınırlama olmaksızın kullanabilirsiniz – daha fazla bilgiyi buradan edinebilirsiniz.
Feragatname
Bilgiler ve yayınlar, TradingView tarafından sağlanan veya onaylanan finansal, yatırım, alım satım veya diğer türden tavsiye veya öneriler anlamına gelmez ve teşkil etmez. Kullanım Koşulları bölümünde daha fazlasını okuyun.
Korumalı komut dosyası
Bu komut dosyası kapalı kaynak olarak yayınlanmaktadır. Ancak, ücretsiz ve herhangi bir sınırlama olmaksızın kullanabilirsiniz – daha fazla bilgiyi buradan edinebilirsiniz.
Feragatname
Bilgiler ve yayınlar, TradingView tarafından sağlanan veya onaylanan finansal, yatırım, alım satım veya diğer türden tavsiye veya öneriler anlamına gelmez ve teşkil etmez. Kullanım Koşulları bölümünde daha fazlasını okuyun.