PROTECTED SOURCE SCRIPT
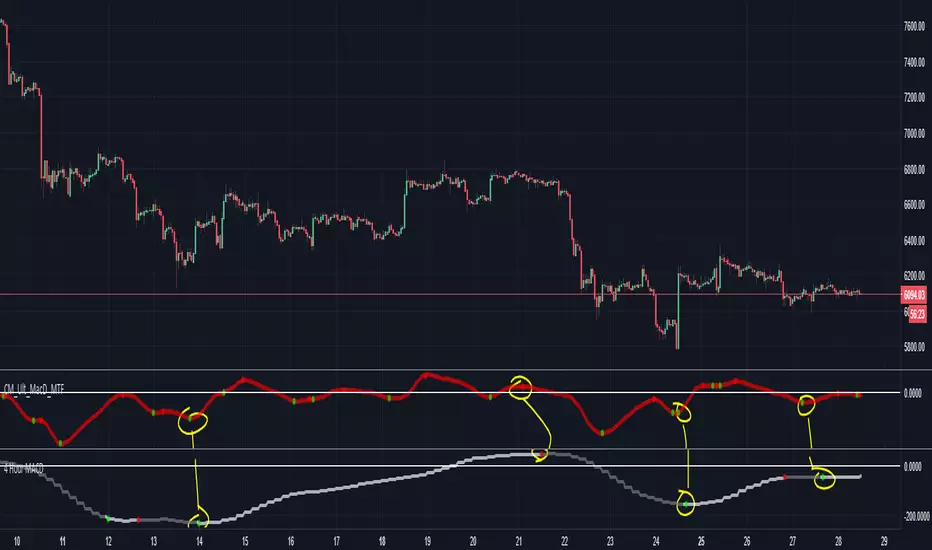
4 Hour MACD, Signal Line Only

I call this my "anchor line" to show me the general direction of where bitcoin -0.51% is going on any given day.
Whether you are trading on 5m, 30m, 1h, this can provide you reinforcement for your directional bias (bullish/bearish)
I like to use this in place of a 50EMA or 200EMA to find the general direction of the trend, because it more precisely captures the fast rallies and dumps
Goes hand in hand with my "Dual Time Frame Momentum Strategy"
Disable the MACD line once you turn it on
Original credits go to ChrisMoody
Korumalı komut dosyası
Bu komut dosyası kapalı kaynak olarak yayınlanmaktadır. Ancak, ücretsiz ve herhangi bir sınırlama olmaksızın kullanabilirsiniz – daha fazla bilgiyi buradan edinebilirsiniz.
Feragatname
Bilgiler ve yayınlar, TradingView tarafından sağlanan veya onaylanan finansal, yatırım, alım satım veya diğer türden tavsiye veya öneriler anlamına gelmez ve teşkil etmez. Kullanım Koşulları bölümünde daha fazlasını okuyun.