OPEN-SOURCE SCRIPT
Crypto Breadth | AlphaNatt

\Crypto Breadth | AlphaNatt\
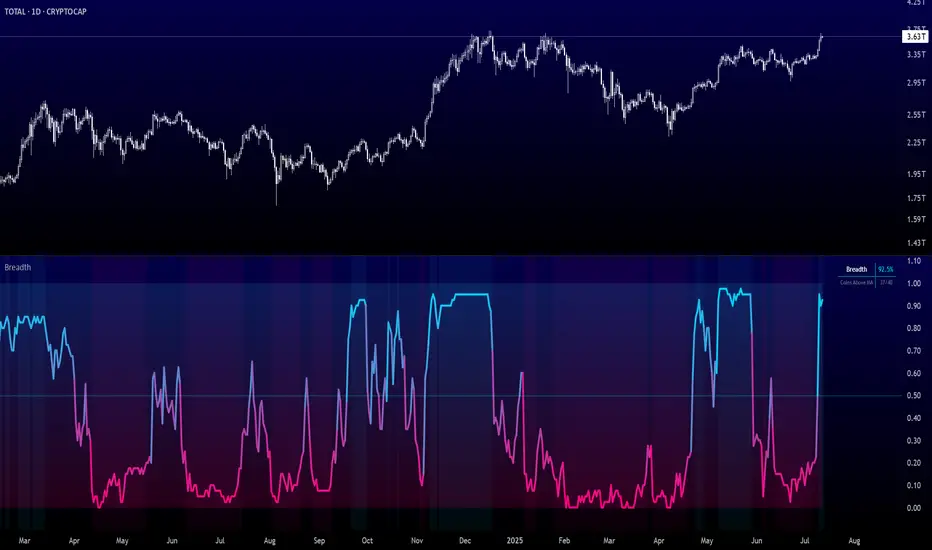
A dynamic, visually modern market breadth indicator designed to track the strength of the top 40 cryptocurrencies by measuring how many are trading above their respective 50-day moving averages. Built with precision, branding consistency, and UI enhancements for fast interpretation.
\📊 What This Script Does\
* Aggregates the performance of \40 major cryptocurrencies\ on Binance
* Calculates a \breadth score (0.00–1.00)\ based on how many tokens are above their moving averages
* Smooths the breadth with optional averaging
* Displays the result as a \dynamic, color-coded line\ with aesthetic glow and gradient fill
* Provides automatic \background zones\ for extreme bullish/bearish conditions
* Includes \alerts\ for key threshold crossovers
* Highlights current values in an \information panel\
\🧠 How It Works\
* Pulls real-time `close` prices for 40 coins (e.g., XRP, BNB, SOL, DOGE, PEPE, RENDER, etc.)
* Compares each coin's price to its 50-day SMA (adjustable)
* Assigns a binary score:
• 1 if the coin is above its MA
• 0 if it’s below
* Aggregates all results and divides by 40 to produce a normalized \breadth percentage\
\🎨 Visual Design Features\
* Smooth blue-to-pink \color gradient\ matching the AlphaNatt brand
* Soft \glow effects\ on the main line for enhanced legibility
* Beautiful \multi-stop fill gradient\ with 16 transition zones
* Optional \background shading\ when extreme sentiment is detected:
• Bullish zone if breadth > 80%
• Bearish zone if breadth < 20%
\⚙️ User Inputs\
* \Moving Average Length\ – Number of periods to calculate each coin’s SMA
* \Smoothing Length\ – Smooths the final breadth value
* \Show Background Zones\ – Toggle extreme sentiment overlays
* \Show Gradient Fill\ – Toggle the modern multicolor area fill
\🛠️ Utility Table (Top Right)\
* Displays live breadth percentage
* Shows how many coins (e.g., 27/40) are currently above their MA
\🔔 Alerts Included\
* \Breadth crosses above 50%\ → Bullish signal
* \Breadth crosses below 50%\ → Bearish signal
* \Breadth > 80%\ → Strong bullish trend
* \Breadth < 20%\ → Strong bearish trend
\📈 Best Used For\
* Gauging overall market strength or weakness
* Timing trend transitions in the crypto market
* Confirming trend-based strategies with broad market support
* Visual dashboard in macro dashboards or strategy overlays
\✅ Designed For\
* Swing traders
* Quantitative investors
* Market structure analysts
* Anyone seeking a macro view of crypto performance
Note: Not financial advise
Açık kaynak kodlu komut dosyası
Gerçek TradingView ruhuyla, bu komut dosyasının mimarı, yatırımcıların işlevselliğini inceleyip doğrulayabilmesi için onu açık kaynaklı hale getirdi. Yazarı tebrik ederiz! Ücretsiz olarak kullanabilseniz de, kodu yeniden yayınlamanın Topluluk Kurallarımıza tabi olduğunu unutmayın.
Free Analysis Platform 👉 alphanatt.com
Feragatname
Bilgiler ve yayınlar, TradingView tarafından sağlanan veya onaylanan finansal, yatırım, alım satım veya diğer türden tavsiye veya öneriler anlamına gelmez ve teşkil etmez. Kullanım Koşulları bölümünde daha fazlasını okuyun.