PROTECTED SOURCE SCRIPT
Strategy Impulse Pivot EU - [AstroHub]

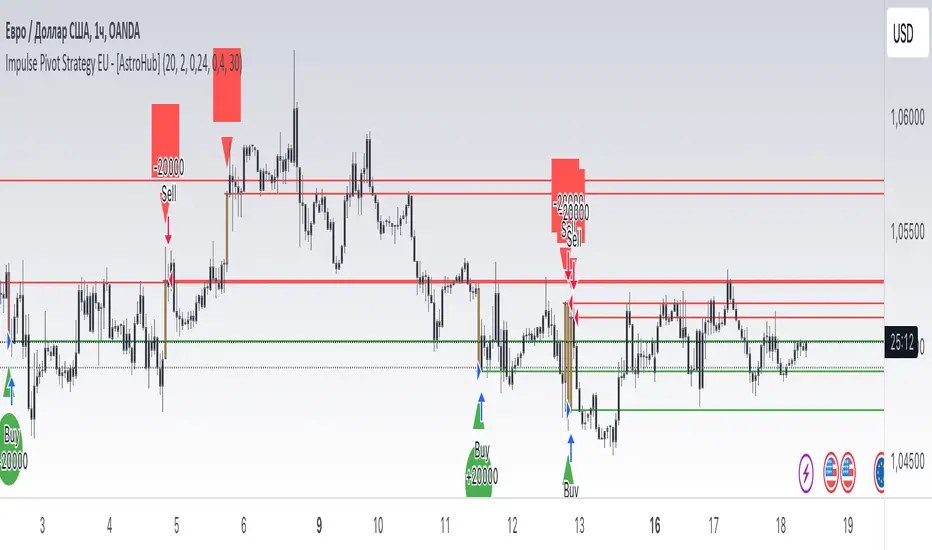
The strategy is built on analyzing market impulses and their intensity. Its main goal is to help traders identify critical market moments when significant changes occur, signaling either a trend continuation or reversal.
Core Methodology
When a Signal Appears
Interpreting the Signals
I recommend using it on currency pairs with a 1-hour and 4-hour chart. EUR/USD, AUD/USD
Indicator Features


Conclusion
Core Methodology
- Impulse Movement [* ]Measured by the difference between the current price and the previous bar’s price.
The indicator filters out minor fluctuations, focusing on meaningful changes. - Color Interpretation
- Candles are color-coded based on the strength and direction of the impulse, providing a quick graphical understanding:
- Green candles: Indicate moderate price growth, potentially signaling the end of the current trend.
- Red candles: Reflect moderate price decline, possibly indicating a trend reversal.
- Orange candles: Highlight strong price movements in either direction, signaling a potential trend continuation or reversal.
- Green candles: Indicate moderate price growth, potentially signaling the end of the current trend.
- Candles are color-coded based on the strength and direction of the impulse, providing a quick graphical understanding:
When a Signal Appears
- Impulse Threshold: The price must change by at least a specified number of pips (e.g., 30 pips). This filters out weak movements.
- Movement Intensity: Impulse is calculated and compared against threshold values to determine the signal’s strength.
- Time Filter: Signals are generated 10 seconds before the hourly bar closes (at 59 minutes and 50 seconds). This ensures traders can prepare to act promptly.
Interpreting the Signals
- Green Candle Moderate price growth: A possible moment to take profit on long positions or open short positions.
- Red Candle Moderate price decline: A potential signal to open long positions or close short positions.
- Orange Candle
- Strong impulse movement:
- If the price rises: A likely continuation of an upward trend.
- If the price falls: A probable intensification of the downward trend.
- If the price rises: A likely continuation of an upward trend.
- Strong impulse movement:
I recommend using it on currency pairs with a 1-hour and 4-hour chart. EUR/USD, AUD/USD
Indicator Features
- Impulse Analysis: The indicator highlights only significant price changes, ignoring market "noise."
- Color Interpretation: Every movement is color-coded, simplifying the visualization of market dynamics.
- Time Filter: Signals appear at critical moments — right before the hour closes. This enhances reliability and gives traders time to react.
- Opening Levels: The indicator automatically marks opening levels for significant signals on the chart, helping traders visualize entry and exit zones.
- Closed Code: The unique logic is protected, preventing unauthorized copying
Conclusion
This indicator is a powerful tool for analyzing impulse movements and their impact on the market. Its logic is straightforward, and its visualization makes signals easy to interpret. Suitable for both beginners and experienced traders, it offers clear entry and exit points with minimal false signal
Korumalı komut dosyası
Bu komut dosyası kapalı kaynak olarak yayınlanmaktadır. Ancak, ücretsiz ve herhangi bir sınırlama olmaksızın kullanabilirsiniz – daha fazla bilgiyi buradan edinebilirsiniz.
Feragatname
Bilgiler ve yayınlar, TradingView tarafından sağlanan veya onaylanan finansal, yatırım, alım satım veya diğer türden tavsiye veya öneriler anlamına gelmez ve teşkil etmez. Kullanım Koşulları bölümünde daha fazlasını okuyun.