OPEN-SOURCE SCRIPT
Custom Price Levels and Averages
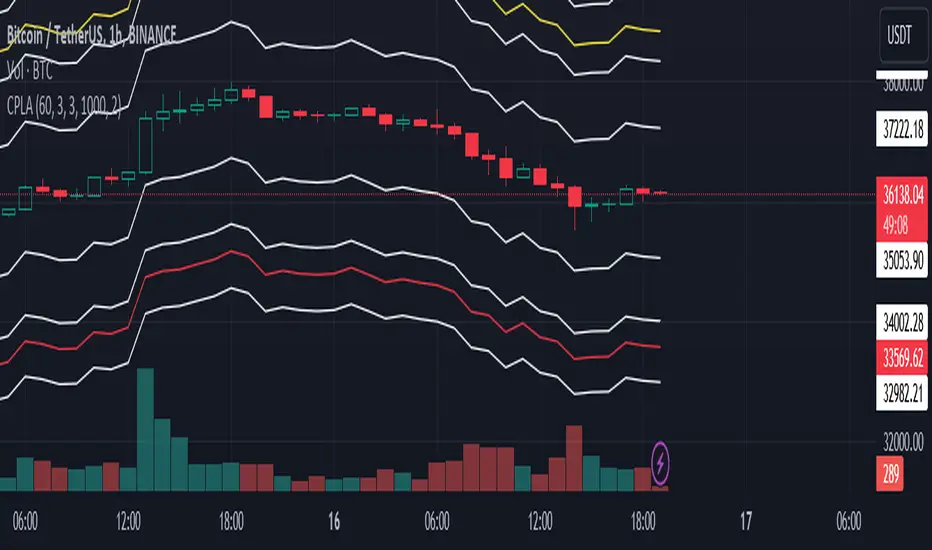
The "Custom Price Levels and Averages" indicator is a versatile tool designed for TradingView. It dynamically calculates and displays key price levels based on user-defined parameters such as distance percentages and position size. The indicator plots three ascending and descending price levels (A, B, C, X, Y, Z) around the last candle close on a specified timeframe. Additionally, it provides the average price for both upward and downward movements, considering the user's specified position size and increase factor. Traders can easily customize the visual appearance by adjusting colors for each plotted line. This indicator assists in identifying potential support and resistance levels and understanding the average price movements within a specified trading context.
Avoid SL hunting by acumulating your position with scaled orders.
Input Parameters:
inputTimeframe: Allows the user to select a specific timeframe (default: "D" for daily).
distancePercentageUp: Determines the percentage increase for ascending price levels (default: 1.5%).
distancePercentageDown: Determines the percentage decrease for descending price levels (default: 1.5%).
position: Specifies the position size in USD for calculating average prices (default: $100).
increaseFactor: Adjusts the increase in position size for each subsequent level (default: 1.5).
calcAvgPrice Function:
Parameters:
priceA, priceB, priceC: Ascending price levels.
priceX, priceY, priceZ: Descending price levels.
position: User-defined position size.
increaseFactor: User-defined increase factor.
Calculation:
Calculates the weighted average price for ascending (priceA, priceB, priceC) and descending (priceX, priceY, priceZ) levels.
Utilizes the specified position size and increase factor to determine the weighted average.
Plotting:
Price Calculations:
priceA, priceB, priceC: Derived by applying percentage increases to the last candle's close.
priceX, priceY, priceZ: Derived by applying percentage decreases to the last candle's close.
avgPriceUp, avgPriceDown: Computed using the calcAvgPrice function for ascending and descending levels, respectively.
Plotting Colors:
User-customizable through input parameters (colorPriceA, colorPriceB, colorPriceC, colorAvgPriceUp, colorPriceX, colorPriceY, colorPriceZ, colorAvgPriceDown).
Styling:
All lines are plotted with minimal thickness (linewidth=1) for a clean visualization.
Overall, the indicator empowers traders to analyze potential support and resistance levels and understand average price movements based on their specified parameters. The flexibility of color customization adds a layer of personalization to suit individual preferences.
Açık kaynak kodlu komut dosyası
Gerçek TradingView ruhuna uygun olarak, bu komut dosyasının oluşturucusu bunu açık kaynaklı hale getirmiştir, böylece yatırımcılar betiğin işlevselliğini inceleyip doğrulayabilir. Yazara saygı! Ücretsiz olarak kullanabilirsiniz, ancak kodu yeniden yayınlamanın Site Kurallarımıza tabi olduğunu unutmayın.
Feragatname
Bilgiler ve yayınlar, TradingView tarafından sağlanan veya onaylanan finansal, yatırım, işlem veya diğer türden tavsiye veya tavsiyeler anlamına gelmez ve teşkil etmez. Kullanım Şartları'nda daha fazlasını okuyun.