OPEN-SOURCE SCRIPT
Variance (Welford) [Loxx]
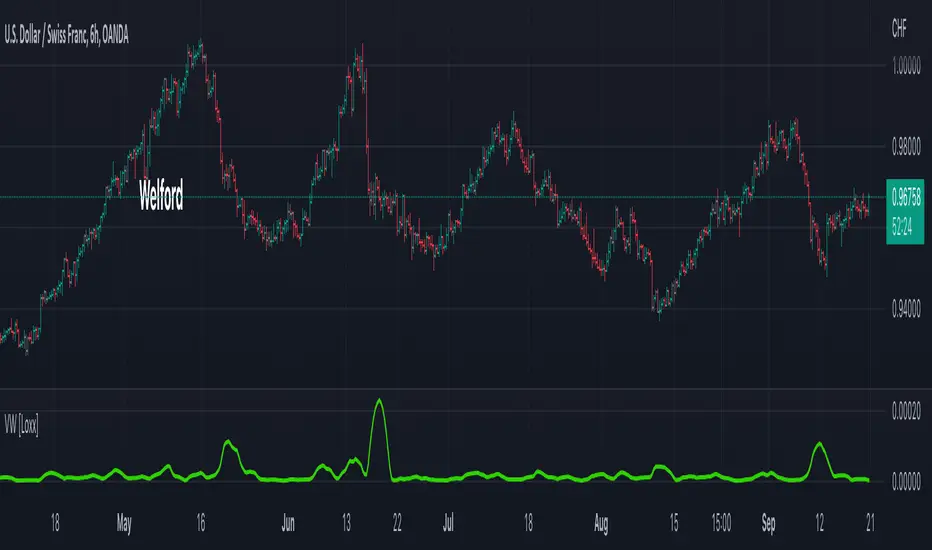
The standard deviation is a measure of how much a dataset differs from its mean; it tells us how dispersed the data are. A dataset that’s pretty much clumped around a single point would have a small standard deviation, while a dataset that’s all over the map would have a large standard deviation. You can. use this calculation for other indicators.
Given a sample the standard deviation is defined as the square root of the variance
Here you can find a Welford’s method for computing (single pass method) that avoids errors in some cases (if the variance is small compared to the square of the mean, and computing the difference leads catastrophic cancellation where significant leading digits are eliminated and the result has a large relative error)
Read more here: https://jonisalonen.com/2013/deriving-welfords-method-for-computing-variance/
Incliuded
- Loxx's Expanded Source Types
Açık kaynak kodlu komut dosyası
Gerçek TradingView ruhuyla, bu komut dosyasının yaratıcısı, yatırımcıların işlevselliğini inceleyip doğrulayabilmesi için onu açık kaynaklı hale getirdi. Yazarı tebrik ederiz! Ücretsiz olarak kullanabilseniz de, kodu yeniden yayınlamanın Topluluk Kurallarımıza tabi olduğunu unutmayın.
Public Telegram Group, t.me/algxtrading_public
VIP Membership Info: patreon.com/algxtrading/membership
VIP Membership Info: patreon.com/algxtrading/membership
Feragatname
Bilgiler ve yayınlar, TradingView tarafından sağlanan veya onaylanan finansal, yatırım, alım satım veya diğer türden tavsiye veya öneriler anlamına gelmez ve teşkil etmez. Kullanım Koşulları bölümünde daha fazlasını okuyun.