OPEN-SOURCE SCRIPT
MACD MultiTimeFrame 1h4h1D [Fantastic Fox]
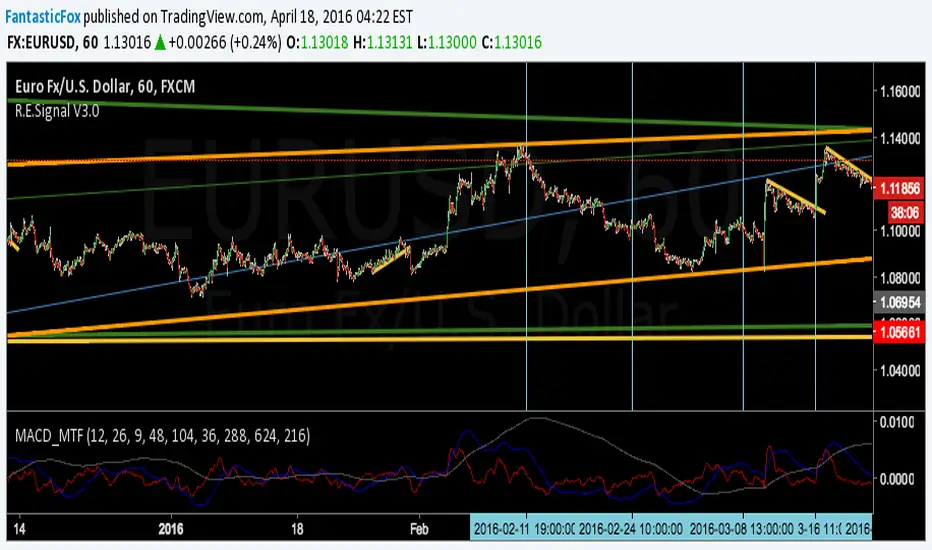
Please insert the indicator into 1h time-frame, otherwise you need to change the lengths' inputs.
When there are tops for two of the MACDs and they are near and close* to each other, there is a big opportunity of a "Major Top" for the security, and vice versa for "Major Bottom".
This indicator can be used for tracing multi time-frame divergence. Also, it could help traders to identify the waves of Elliott Wave, and as a signal for confirmation of an impulse after a correction or retracement.
* They should be on top of each others head, not crossing each other. not necessarily touching, but not so far from each other.
Açık kaynak kodlu komut dosyası
Gerçek TradingView ruhuyla, bu komut dosyasının mimarı, yatırımcıların işlevselliğini inceleyip doğrulayabilmesi için onu açık kaynaklı hale getirdi. Yazarı tebrik ederiz! Ücretsiz olarak kullanabilseniz de, kodu yeniden yayınlamanın Topluluk Kurallarımıza tabi olduğunu unutmayın.
Feragatname
Bilgiler ve yayınlar, TradingView tarafından sağlanan veya onaylanan finansal, yatırım, alım satım veya diğer türden tavsiye veya öneriler anlamına gelmez ve teşkil etmez. Kullanım Koşulları bölümünde daha fazlasını okuyun.