OPEN-SOURCE SCRIPT
MACD divergence with line drawing by Rexio
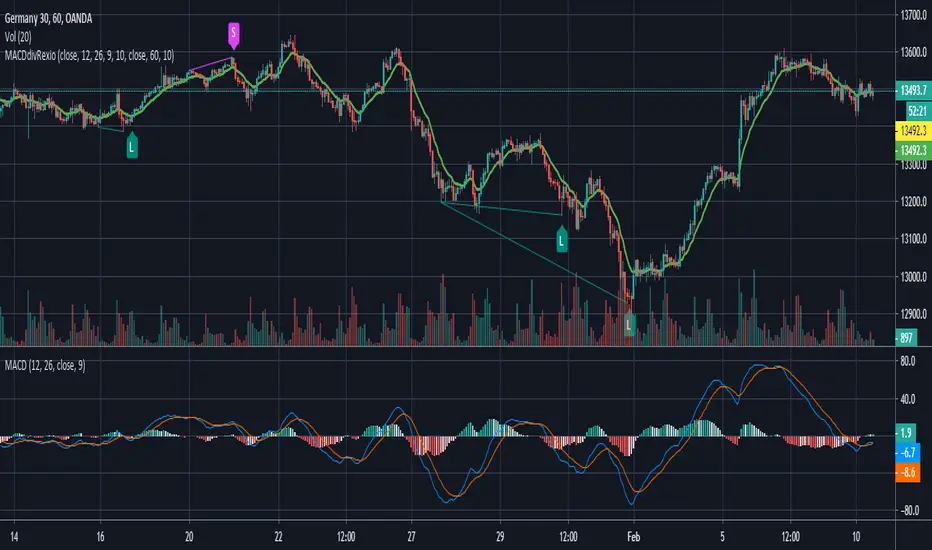
Another appoach to finding divergences at MACD. This time I think it is much smoother so I could check for divergences between two "peaks" at MACD.
I added my SL line which is last peak +- 1xATR. And the second line is peak between two points of divergence and most of the time it acts like an SR line.
If the higher timeframe trend backs up our divergence (for example: higher trend UP - divergence for L position) I can try to jump in after crossing EMA10.
This indicator is only sugestion for me. I always check price action, trend, SR line before I take any action.
Every people who will test this indicator need to know basics about divergences as THISE ARE NOT BUY/SELL SIGNALS.
If you want to help me and support my coding please contact me via private msg.
Açık kaynak kodlu komut dosyası
Gerçek TradingView ruhuyla, bu komut dosyasının mimarı, yatırımcıların işlevselliğini inceleyip doğrulayabilmesi için onu açık kaynaklı hale getirdi. Yazarı tebrik ederiz! Ücretsiz olarak kullanabilseniz de, kodu yeniden yayınlamanın Topluluk Kurallarımıza tabi olduğunu unutmayın.
Feragatname
Bilgiler ve yayınlar, TradingView tarafından sağlanan veya onaylanan finansal, yatırım, alım satım veya diğer türden tavsiye veya öneriler anlamına gelmez ve teşkil etmez. Kullanım Koşulları bölümünde daha fazlasını okuyun.