OPEN-SOURCE SCRIPT
[KVA] Kamvia Directional Movement
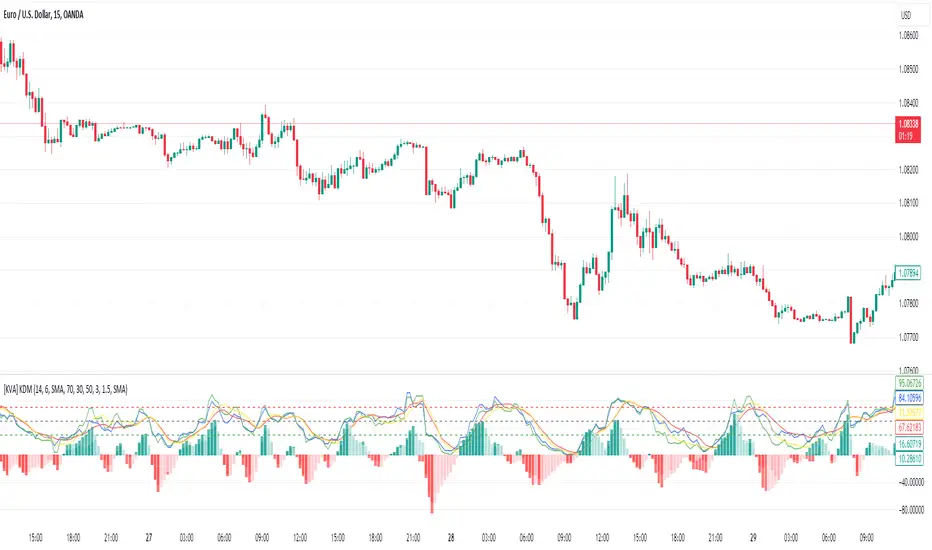
Kamvia Directional Movement (KDM) Indicator is an analytical tool designed to identify potential buying and selling opportunities in the market. It highlights the phases of price depletion which typically align with price highs and lows, offering a nuanced understanding of market dynamics.
Efficient at pinpointing trend breakdowns and excelling in the identification of intra-day entry and exit points, the Kamvia Directional Movement Indicator is a valuable asset for traders aiming to optimize their market strategies.
The KDM not only takes into account the traditional high and low price points within its analysis but also introduces an innovative approach by incorporating the concepts of body high and body low. This nuanced analysis offers a deeper insight into market momentum and potential shifts in market dynamics.
High and Low Analysis: The indicator examines the price highs and lows to gauge the overall market volatility and potential turning points. By analyzing these extremities, traders can get a sense of market strength and possible shifts in trend direction. The high points indicate periods of maximum buying interest, potentially signaling overbought conditions, while the low points reflect selling interest, hinting at oversold conditions.
Body High and Body Low Analysis: Unique to the KDM Indicator is the emphasis on the body of the candlestick, which is the range between the open and close prices. This analysis offers a more refined view of market sentiment by focusing on the actual trading range experienced within the period. The body high (the upper end of the candlestick body) and body low (the lower end of the candlestick body) provide insights into the buying and selling pressure during the trading session, beyond mere price extremities.
The indicator is calibrated on a scale from 0 to 100, making interpretation intuitive and straightforward. A reading above 70 is considered to be in the overbought region, suggesting that the market might be experiencing a heightened level of buying activity that could lead to a potential pullback or reversal. Conversely, a reading below 30 falls into the oversold region, indicating a possible exhaustion in selling pressure and a potential for market reversal or bounce back.
This scale and the detailed analysis of both price and body dynamics equip traders with a comprehensive tool for assessing market conditions. The distinction between high/low and body high/body low analysis enriches the indicator's capability to provide more targeted insights into market behavior, enabling traders to make more nuanced decisions based on a broader spectrum of information. By identifying the duration and extent to which these conditions persist, traders can better interpret the market's momentum and align their strategies with the prevailing trend or prepare for an impending reversal.
KDM Strategy
The strategy focuses on spotting price reversals within a confirmed trend. While the indicator features regions indicating overbought and oversold conditions, these signals alone are not sufficient predictors of a market reversal.
The terms "overbought" and "oversold" describe scenarios where prices reach levels that are unusually high or low within a specified look-back period. Entering these zones often indicates a continuation of the trend rather than a reversal.
A "strongly overbought" condition signals buying pressure, whereas a "strongly oversold" condition indicates selling pressure. The key to leveraging these conditions lies in analyzing the duration for which the market remains in either state. This duration can provide critical insights into whether the market is trending or ranging.
Extended periods in extreme overbought territories confirm an uptrend, while prolonged presence in slight overbought zones (above 50 but below 70, for example) suggests a more moderate uptrend. Conventionally, levels above 70 signal extreme overbought conditions, and those below 30 indicate extreme oversold conditions.
Traders are advised to exercise caution when the oscillator stays within these extreme areas. Ideally, the strategy involves capitalizing on temporary price drops within an overall uptrend or on temporary price spikes within an overall downtrend.
Identifying trading opportunities with the KDM Indicator involves looking for the indicator to exit these extreme overbought or oversold regions, signaling potential reversals or continuations in the market's direction. This approach helps traders make informed decisions by considering the broader market trend alongside short-term price movements.
Açık kaynak kodlu komut dosyası
Gerçek TradingView ruhuna uygun olarak, bu komut dosyasının oluşturucusu bunu açık kaynaklı hale getirmiştir, böylece yatırımcılar betiğin işlevselliğini inceleyip doğrulayabilir. Yazara saygı! Ücretsiz olarak kullanabilirsiniz, ancak kodu yeniden yayınlamanın Site Kurallarımıza tabi olduğunu unutmayın.
Feragatname
Bilgiler ve yayınlar, TradingView tarafından sağlanan veya onaylanan finansal, yatırım, işlem veya diğer türden tavsiye veya tavsiyeler anlamına gelmez ve teşkil etmez. Kullanım Şartları'nda daha fazlasını okuyun.