snowsilence

Substratum Module [snowsilence]

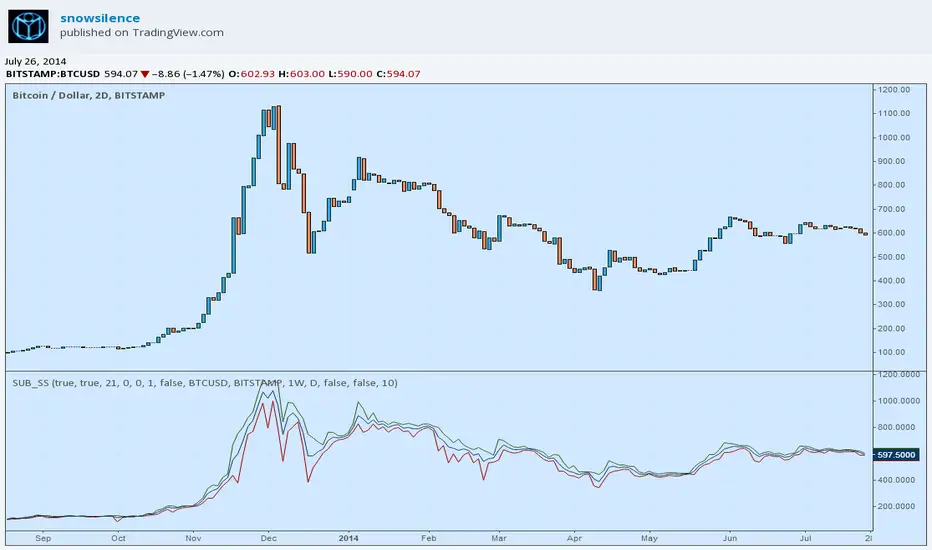
This module is meant to act as a framework and platform over which to develop other indicators. On its own it does essentially nothing, yet simplifies the work of adding basic customizations and flexibility to ideas immediately. The chart on this post is not a demo, so its better to just try adding the indicator to a test chart — you may find it more convenient to set "overlay=true" in the study header — and look into the settings for an intuitive sense of its purpose.

Please build off of this, let me know if you find it useful, and credit/reference me where it seems reasonable. Feedback is always appreciated!
Açık kaynak kodlu komut dosyası

Gerçek TradingView ruhuyla, bu betiğin yazarı, yatırımcının anlayabilmesi ve doğrulayabilmesi için onu açık kaynak olarak yayınladı. Yazarın eline sağlık! Bunu ücretsiz olarak kullanabilirsiniz, ancak bu kodun bir yayında yeniden kullanımı Kullanım Koşulları ile yönetilir. Bir grafikte kullanmak için favorilere ekleyebilirsiniz.

Feragatname

Bilgiler ve yayınlar, TradingView tarafından sağlanan veya onaylanan finansal, yatırım, işlem veya diğer türden tavsiye veya tavsiyeler anlamına gelmez ve teşkil etmez. Kullanım Şartları'nda daha fazlasını okuyun.

Bu komut dosyasını bir grafikte kullanmak ister misiniz?
study("Substratum Module", "SUB_SS", overlay=false)

// This module/sub-indicator — "Substratum" [v0.1] (by snowsilence) — is meant to act
// as a framework and platform over which to develop other indicators.
// On its own it does essentially nothing but simplify the work of adding
// basic customizations and flexibility to ideas immediately. 
// Please build off of this, let me know if you find useful, 
// and credit/reference me where it seems reasonable.
// Feedback is always appreciated.

use_auto = input(true, title = "Auto-sense Security & Interval", type = bool, defval=true)
use_HA = input(true, title = "Use 'Heiken Ashi' Bar Values?", type = bool, defval = true)

length = input(title="Bin Size/Length",defval=21, minval = 1)
lb = input(0, "Series Look-back Depth (n-Bars)", type = integer, minval = 0)
off_set = input(0, "Plot Offset", defval = 0, type = integer)
off_mult = input(1, "Offset Multiplier",minval=1, type=integer)
offset = (off_mult)*(off_set)

use_cti = input(false, title = "Use Custom Parameters? (First Disable Auto-Sense)", type = bool)
SEC_0 = input("BITSTAMP:BTCUSD", "Security", type = symbol) //This is the default security used when 'custom' mode is enabled. It should have been possible to user the built-in variable "tickerid" in the input in place of the string, but there is a bug in the Pine script disallowing this.
TI = use_cti ? input("1W","Interval:", type=string) : input("D", "Default Interval (If None Specified) :", type = resolution)

logW(x,b)=>log(x)/log(b)
use_log=input(false,title="Output Signal Log Base-b",type=bool)
use_pow=input(false,title="XOR Output to bth Power",type=bool)
b=input(10,"b",minval=2,type=float)

SEC = use_HA ? heikenashi(SEC_0) : SEC_0

O = use_auto ? open[lb] : (use_log?(security(SEC, TI, logW(open[lb],b))):use_pow?(security(SEC, TI, pow(open[lb],b))):security(SEC, TI, open[lb]))
H = use_auto ? high[lb] : (use_log?(security(SEC, TI, logW(high[lb],b))):use_pow?(security(SEC, TI, pow(high[lb],b))):security(SEC, TI, high[lb]))
L = use_auto ? low[lb] : (use_log?(security(SEC, TI, logW(low[lb],b))):use_pow?(security(SEC, TI, pow(low[lb],b))):security(SEC, TI, low[lb]))
C = use_auto ? close[lb] : (use_log?(security(SEC, TI, logW(close[lb],b))):use_pow?(security(SEC, TI, pow(close[lb],b))):security(SEC, TI, close[lb]))
A3 = use_auto ? hlc3[lb] : (use_log?(security(SEC, TI, logW(hlc3[lb],b))):use_pow?(security(SEC, TI, pow(hlc3[lb],b))):security(SEC, TI, hlc3[lb]))
A4 = use_auto ? ohlc4[lb] : (use_log?(security(SEC, TI, logW(ohlc4[lb],b))):use_pow?(security(SEC, TI, pow(ohlc4[lb],b))):security(SEC, TI, ohlc4[lb]))

//Basic 'High|OHLC4|Low' Plot Example

plot(L, color = #990000, offset = offset)
plot(H, color = #2B5715, offset = offset)
plot(A4,color = #073763, offset = offset)

//Generalize Traditional Pivots Example (Uncomment below; re-comment above example)

// p = A3
// s_1 = (2*p) - H
// s_2 = p - (H - L)
// s_3 = L - (2 * (H - p))
// r_1= (2*p) - L
// r_2 = p + (H - L)
// r_3 = H + (2 * (p - L))

// plot(p, color=black,offset=offset)
// plot(s_1, color=lime,offset=offset)
// plot(s_2, color=green,offset=offset)
// plot(s_3, color=black,offset=offset)
// plot(r_1, color=red,offset=offset)
// plot(r_2, color=maroon,offset=offset)
// plot(r_3, color=black,offset=offset)