OPEN-SOURCE SCRIPT
Exponential Bollinger Bands
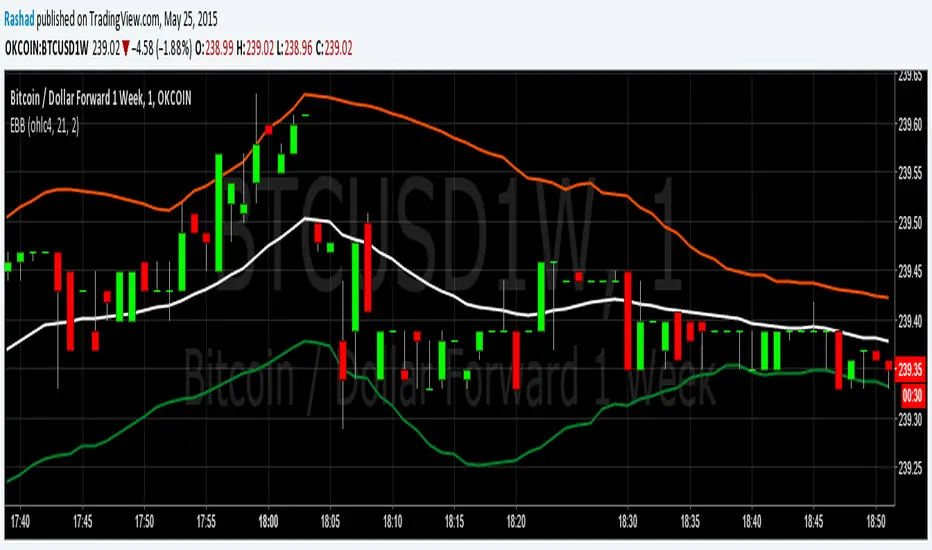
These Bollinger Bands are exponential because the variance is calculated using the exponential moving average, rather than just adding the normal standard deviation to the ema. This may be more useful because the exponential standard deviation should be more sensitive to near term increases or decreases in volatility.
Please do not forget that Bollinger Bands should always be combined with another method of analysis. Bollinger Bands just provide an easy way to gauge where the price could range in. At 2 standard deviations of a continuously random variable, more than 98% of data points are in this range. I am however going to test this in excel to get the average number of data points that stay in the range for Bitcoin. I will upload my findings when I complete that. Please monitor this description if your interested.
Please do not forget that Bollinger Bands should always be combined with another method of analysis. Bollinger Bands just provide an easy way to gauge where the price could range in. At 2 standard deviations of a continuously random variable, more than 98% of data points are in this range. I am however going to test this in excel to get the average number of data points that stay in the range for Bitcoin. I will upload my findings when I complete that. Please monitor this description if your interested.
Açık kaynak kodlu komut dosyası
Gerçek TradingView ruhuna uygun olarak, bu komut dosyasının oluşturucusu bunu açık kaynaklı hale getirmiştir, böylece yatırımcılar betiğin işlevselliğini inceleyip doğrulayabilir. Yazara saygı! Ücretsiz olarak kullanabilirsiniz, ancak kodu yeniden yayınlamanın Site Kurallarımıza tabi olduğunu unutmayın.
Feragatname
Bilgiler ve yayınlar, TradingView tarafından sağlanan veya onaylanan finansal, yatırım, işlem veya diğer türden tavsiye veya tavsiyeler anlamına gelmez ve teşkil etmez. Kullanım Şartları'nda daha fazlasını okuyun.