OPEN-SOURCE SCRIPT
Multi-TF EMA 5/8-ChartTicker-Dashboard
⚙️ Key Components
Timeframes & Weights
Uses 5 different intraday timeframes: 2m, 5m, 15m, 30m, 60m.
Each TF has a weight:
2m = 1
5m = 2
15m = 4
30m = 8
60m = 16
👉 Higher timeframe signals contribute more to the total.
Signal Logic per Timeframe
For each TF, calculate EMA 5 and EMA 8.
If EMA5 > EMA8 → Buy (B, +1).
If EMA5 < EMA8 → Sell (S, –1).
Total Score Calculation
Each signal (+1 or –1) is multiplied by its timeframe weight.
All weighted signals are summed into a total score.
Positive = bullish bias, negative = bearish bias.
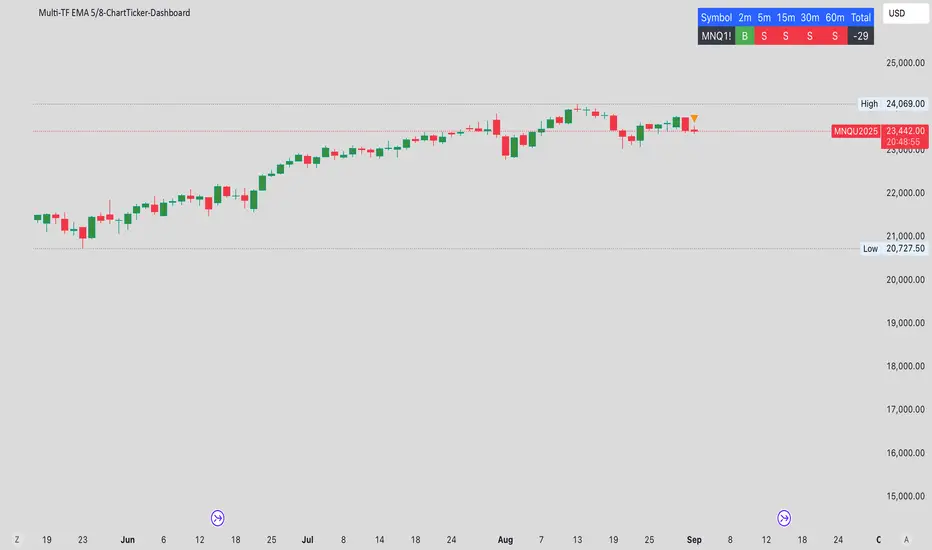
Dashboard Table (top-right corner)
Row 1 (header): Symbol, each timeframe (2m, 5m, 15m, 30m, 60m), Total.
Row 2 (values):
Symbol name.
B (green) or S (red) per timeframe.
Weighted Total score.
🛠️ Overall Function
This indicator is essentially a multi-timeframe EMA trend dashboard that:
Shows Buy/Sell alignment across multiple TFs.
Provides a weighted trend score to quickly assess market bias.
Makes it easy to spot whether short- and long-term signals agree or conflict.
Timeframes & Weights
Uses 5 different intraday timeframes: 2m, 5m, 15m, 30m, 60m.
Each TF has a weight:
2m = 1
5m = 2
15m = 4
30m = 8
60m = 16
👉 Higher timeframe signals contribute more to the total.
Signal Logic per Timeframe
For each TF, calculate EMA 5 and EMA 8.
If EMA5 > EMA8 → Buy (B, +1).
If EMA5 < EMA8 → Sell (S, –1).
Total Score Calculation
Each signal (+1 or –1) is multiplied by its timeframe weight.
All weighted signals are summed into a total score.
Positive = bullish bias, negative = bearish bias.
Dashboard Table (top-right corner)
Row 1 (header): Symbol, each timeframe (2m, 5m, 15m, 30m, 60m), Total.
Row 2 (values):
Symbol name.
B (green) or S (red) per timeframe.
Weighted Total score.
🛠️ Overall Function
This indicator is essentially a multi-timeframe EMA trend dashboard that:
Shows Buy/Sell alignment across multiple TFs.
Provides a weighted trend score to quickly assess market bias.
Makes it easy to spot whether short- and long-term signals agree or conflict.
Açık kaynak kodlu komut dosyası
Gerçek TradingView ruhuna uygun olarak, bu komut dosyasının oluşturucusu bunu açık kaynaklı hale getirmiştir, böylece yatırımcılar betiğin işlevselliğini inceleyip doğrulayabilir. Yazara saygı! Ücretsiz olarak kullanabilirsiniz, ancak kodu yeniden yayınlamanın Site Kurallarımıza tabi olduğunu unutmayın.
Feragatname
Bilgiler ve yayınlar, TradingView tarafından sağlanan veya onaylanan finansal, yatırım, işlem veya diğer türden tavsiye veya tavsiyeler anlamına gelmez ve teşkil etmez. Kullanım Şartları'nda daha fazlasını okuyun.