OPEN-SOURCE SCRIPT
Güncellendi Divergence Indicator
Description:
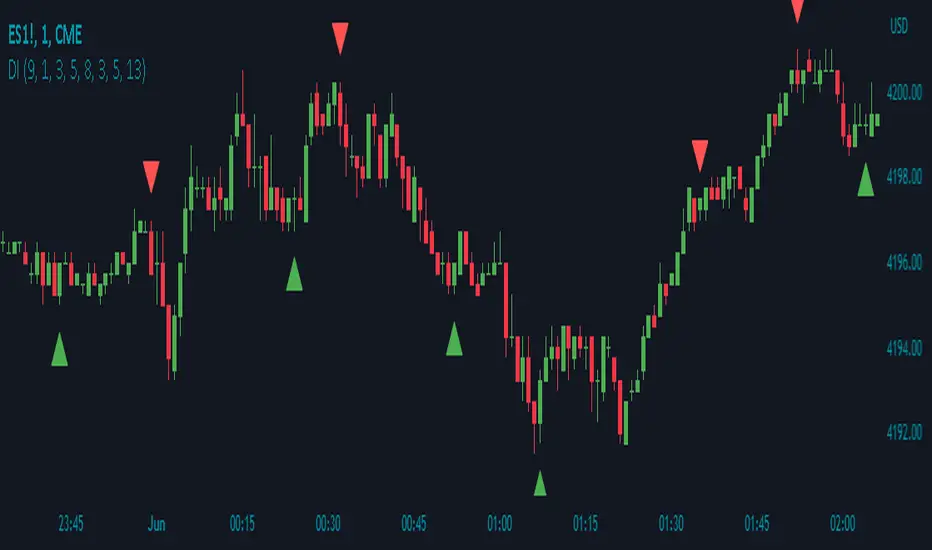
The Divergence Indicator (DI) is a powerful technical analysis tool designed to identify potential bullish and bearish signals based on multiple indicators, including RSI, Stochastic Oscillator, MACD, and EMA. It helps traders spot divergences between price and these indicators, indicating potential trend reversals or continuations.
How it Works:
The Divergence Indicator compares various indicators and their relationships with price to identify bullish and bearish signals. It considers conditions such as rising or falling values of the Stochastic Oscillator (%K), RSI, and MACD lines, as well as the crossover and crossunder of the MACD Line and Signal Line. Additionally, it evaluates the relationship between fast and slow Exponential Moving Averages (EMA) to detect divergences. When a bullish or bearish condition is met, circles are plotted on the chart to highlight the signals.
Usage:
To effectively utilize the Divergence Indicator, follow these steps:
1. Apply the DI indicator to your chart by adding it from the available indicators.
2. Customize the color settings to suit your preferences. The bullish and bearish colors determine the colors of the plotted circles.
3. Observe the circles plotted on the chart:
- Bullish circles indicate potential bullish signals.
- Bearish circles indicate potential bearish signals.
4. Interpret the signals provided by the indicator:
- A bullish signal may occur when there is price divergence accompanied by rising values of the Stochastic Oscillator (%K), RSI, and MACD lines, or when the MACD Line crosses above the Signal Line. Additionally, a histogram value close to zero may strengthen the signal.
- A bearish signal may occur when there is price divergence accompanied by falling values of the Stochastic Oscillator (%K), RSI, and MACD lines, or when the MACD Line crosses below the Signal Line. A histogram value close to zero may also strengthen the signal.
5. Be cautious of false signals by considering additional factors such as the relationship between the fast and slow Exponential Moving Averages (EMA). If the EMAs or MACD values do not support the identified divergence, the signal may be less reliable.
6. Combine the signals from the Divergence Indicator with other technical analysis tools, such as support and resistance levels, trend lines, or candlestick patterns, to confirm potential trade setups.
7. Implement appropriate risk management strategies, including setting stop-loss orders and position sizing, to manage your trades effectively and protect your capital.
Note: The Divergence Indicator provides valuable insights into potential trend reversals or continuations based on divergences between price and multiple indicators. However, it is recommended to use this indicator in conjunction with other technical analysis tools and perform thorough analysis before making trading decisions.
Sürüm Notları
Bullish and bearish color options have been moved to the top of the settings menu.Sürüm Notları
Alerts have been added to the script.Sürüm Notları
Alerts happen only when a candle closes with a signal. The alert will happen at the beginning of the following candle.Sürüm Notları
Indicator shapes and locations are now customizable.Sürüm Notları
In the Indicator Settings:1. The "Create Alerts" option has been moved to the top of the "Inputs" tab
2. Color, Shape, and Location options are all moved to the "Style" tab
Açık kaynak kodlu komut dosyası
Gerçek TradingView ruhuna uygun olarak, bu komut dosyasının oluşturucusu bunu açık kaynaklı hale getirmiştir, böylece yatırımcılar betiğin işlevselliğini inceleyip doğrulayabilir. Yazara saygı! Ücretsiz olarak kullanabilirsiniz, ancak kodu yeniden yayınlamanın Site Kurallarımıza tabi olduğunu unutmayın.
Feragatname
Bilgiler ve yayınlar, TradingView tarafından sağlanan veya onaylanan finansal, yatırım, işlem veya diğer türden tavsiye veya tavsiyeler anlamına gelmez ve teşkil etmez. Kullanım Şartları'nda daha fazlasını okuyun.