PROTECTED SOURCE SCRIPT
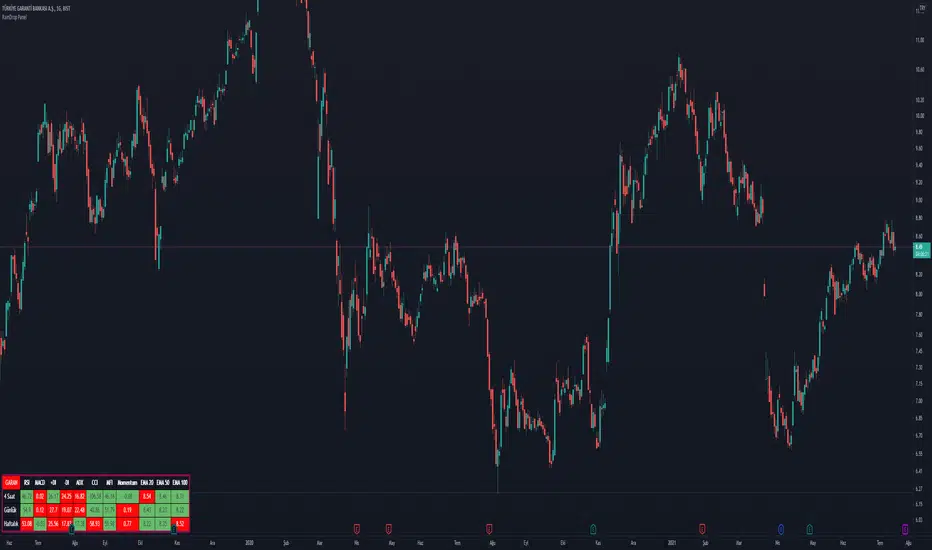
RainDrop Panel
Hi everyone,
This script shows the Dashboard in a Table. Table.new() is a new feature and released today! Big thanks to Pine Team for adding this great new feature!
This new feature changes the rules of the game! The script shows 3 different time period indicator values for the icon and changes the background color of each cell using the current and last values of the indicators for the icon. The background color is green if the current value is greater than the last value, red if it is less than the last value, and gray if it is equal. You can select the time periods and Indicators to be displayed. You can also change the position, font sizes, title and text colors of the relevant panel on the graphic. The number of columns in the table is dynamic and changes according to the number of indicators. You can choose 1 Symbol, 3 different timeframes, 6 Indicators and 4 Simple or Exponential Moving Averages, specify the type and length of moving averages. You can also set the lengths for each Indicator. Indicators: - RSI – MACD - DMI (+DI and -DI + and ADX) - CCI - MFI - Push - EMA Length 20 (length adjustable) - EMA Length 50 (length adjustable) EMA Length 100 (length adjustable) - EMA Length 200 (length adjustable)
Korumalı komut dosyası
Bu komut dosyası kapalı kaynak olarak yayınlanmaktadır. Ancak, özgürce ve herhangi bir sınırlama olmaksızın kullanabilirsiniz – daha fazla bilgi burada.
Feragatname
Bilgiler ve yayınlar, TradingView tarafından sağlanan veya onaylanan finansal, yatırım, işlem veya diğer türden tavsiye veya tavsiyeler anlamına gelmez ve teşkil etmez. Kullanım Şartları'nda daha fazlasını okuyun.