OPEN-SOURCE SCRIPT
SMU STDEV Overlap Candles with Highest and Lowest
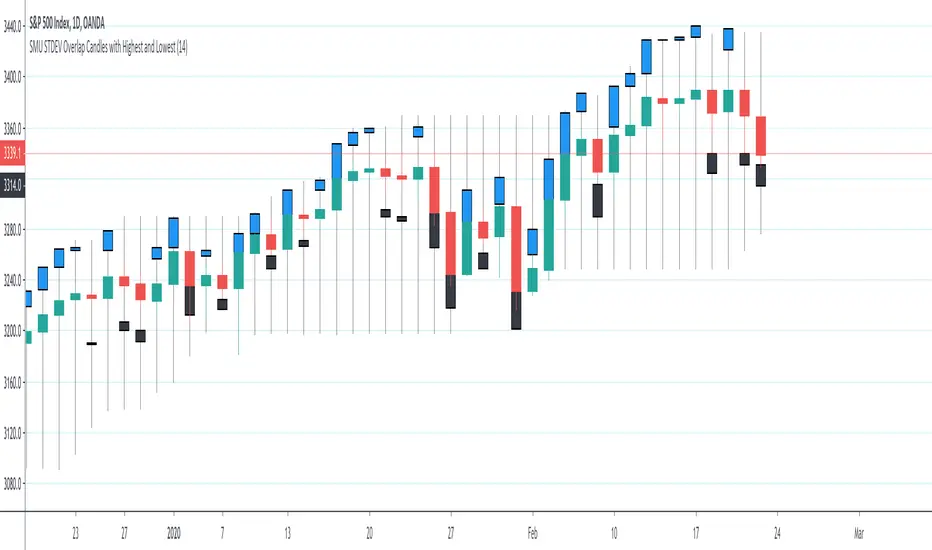
This script creates a STDEV in a candle format overlayed on the actual candles. The STDEV candles lead with deviation to upside or downside.
The Blue bars are Upside heads-up showing the strength of the uptrend before it happens.
The Black candles are downside indicators pulling on the price
I like price action because it is raw. So for High and Low I used the highest and lowest amount so when you trade you can see where the price is in relation to previous high and low
I use this script in conjunction with my first STDEV candles to get the full picture in short time frames. For example, when I see the STDEV of above 6 on change of direction then I trade on it before the trend begins and confirm it with STDEV overlay
If you have you been following my scripts you notice the code is very simple but the concept is very powerful. My hope is better pine script coders to build on these scripts and publish more out of the box type of scripts.
Enjoy
Açık kaynak kodlu komut dosyası
Gerçek TradingView ruhuna uygun olarak, bu komut dosyasının oluşturucusu bunu açık kaynaklı hale getirmiştir, böylece yatırımcılar betiğin işlevselliğini inceleyip doğrulayabilir. Yazara saygı! Ücretsiz olarak kullanabilirsiniz, ancak kodu yeniden yayınlamanın Site Kurallarımıza tabi olduğunu unutmayın.
Feragatname
Bilgiler ve yayınlar, TradingView tarafından sağlanan veya onaylanan finansal, yatırım, işlem veya diğer türden tavsiye veya tavsiyeler anlamına gelmez ve teşkil etmez. Kullanım Şartları'nda daha fazlasını okuyun.