OPEN-SOURCE SCRIPT
Güncellendi SCTI-RSK
SCTI-RSK 是一个多功能技术指标合集,整合了多种常用技术指标于一个图表中,方便交易者综合分析市场状况。该指标包含以下五个主要技术指标模块,每个模块都可以单独显示或隐藏:
Stoch RSI - 随机相对强弱指数
KDJ - 随机指标
RSI - 相对强弱指数
CCI - 商品通道指数
Williams %R - 威廉指标
主要特点
模块化设计:每个指标都可以单独开启或关闭显示
交叉信号可视化:Stoch RSI和KDJ的金叉/死叉信号有彩色填充标识
多时间框架分析:支持不同长度的参数设置
直观界面:清晰的参数分组和颜色区分
适用场景
趋势判断
超买超卖区域识别
交易信号确认
多指标共振分析
English Description
SCTI-RSK is a comprehensive technical indicator that combines multiple popular indicators into a single chart for traders to analyze market conditions holistically. The indicator includes the following five main technical indicator modules, each can be toggled on/off individually:
Stoch RSI - Stochastic Relative Strength Index
KDJ - Stochastic Oscillator
RSI - Relative Strength Index
CCI - Commodity Channel Index
Williams %R - Williams Percent Range
Key Features
Modular Design: Each indicator can be shown or hidden independently
Visual Crossover Signals: Golden/Death crosses are highlighted with color fills for Stoch RSI and KDJ
Multi-Timeframe Analysis: Supports different length parameters
Intuitive Interface: Clear parameter grouping and color differentiation
Use Cases
Trend identification
Overbought/Oversold zone recognition
Trade signal confirmation
Multi-indicator confluence analysis
参数说明 (Parameter Explanation)
指标参数分为6个主要组别:
基础指标设置 - 控制各指标的显示/隐藏
Stoch RSI 设置 - 包括K值、D值、RSI长度等参数
KDJ 设置 - 包括周期、信号线等参数
RSI 设置 - 包括RSI长度、中期长度等参数
CCI 设置 - 包括CCI长度、中期长度等参数
Williams %R 设置 - 包括长度参数
使用建议 (Usage Suggestions)
初次使用时,可以先开启所有指标观察它们的相互关系
根据个人交易风格调整各指标的长度参数
关注多指标同时发出信号时的交易机会
结合价格行为和其他分析工具确认信号
更新日志 (Changelog)
v1.0 初始版本,整合五大技术指标
Sürüm Notları
SCTI-RSK - Multi-Indicator Composite ToolEnglish Description
Overview:
SCTI-RSK is a comprehensive technical analysis indicator that combines six popular oscillators into one powerful tool. It features customizable display options for each component, allowing traders to focus on the indicators most relevant to their strategy.
Key Features:
Stoch RSI - Momentum oscillator showing overbought/oversold conditions with golden/death cross visualizations
KDJ Indicator - Customizable KDJ oscillator with crossover signals
Dual RSI - Short-term (8) and mid-term (22) RSI with standard 50 midline
Dual CCI - Short-term (33) and long-term (89) CCI with normalized scaling
Williams %R - Classic overbought/oversold indicator (22-period)
Money Flow Index - Volume-weighted momentum indicator (28-period)
Unique Features:
Toggle visibility for each indicator individually
Visual crossover signals with color-coded fills
Consistent scaling (0-100) for easy comparison
Clean, organized parameter grouping
Usage Suggestions:
Combine signals from multiple indicators for confirmation
Use different timeframes for each indicator component
Watch for convergences/divergences between indicators
中文描述
指标概述:
SCTI-RSK 是一个多功能复合型技术指标,整合了六种常用振荡器于同一面板。该指标允许自定义显示各个组件,帮助交易者根据自身策略重点关注相关信号。
主要功能:
随机RSI - 动量振荡器,显示超买超卖状态并标注金叉死叉
KDJ指标 - 可自定义参数的KDJ振荡器,含交叉信号提示
双周期RSI - 短期(8)和中期(22)RSI组合
双周期CCI - 短期(33)和长期(89)CCI标准化显示
威廉指标%R - 经典超买超卖指标(22周期)
资金流量指数MFI - 结合价格的成交量动量指标(28周期)
特色功能:
可单独开关每个指标显示
彩色填充标注交叉信号
统一标准化缩放(0-100范围)
参数分组清晰,便于设置
使用建议:
结合多个指标信号确认交易时机
为不同组件设置不同周期参数
观察各指标间的背离/共振现象
This description highlights:
The comprehensive nature of your composite indicator
Each component's unique value
The customization options
Practical usage scenarios
Both English and Chinese versions for wider accessibility
The structure makes it easy for users to quickly understand what your indicator does and how they might use it. You can paste this directly into your publishing platform when sharing the script.
Sürüm Notları
SCTI-RSK: Multi-Timeframe Composite OscillatorThe SCTI-RSK (Smart Composite Technical Indicator - Relative Strength & KDJ) is a powerful, all-in-one oscillator panel designed for traders who rely on momentum and overbought/oversold conditions. It intelligently combines and normalizes seven of the most popular technical indicators into a single, cohesive view, allowing for quick and efficient multi-factor market analysis.
Key Features:
Unified Oscillator View: Integrates Stoch RSI, KDJ, RSI, CCI, Williams %R, MFI, and a specially adapted MACD into one easy-to-read window, eliminating chart clutter.
Customizable Display: Toggle each indicator on/off individually to focus on the signals that matter most to your strategy.
Smart Scaling & Alignment: All oscillators are normalized to a common scale (typically 0-100), making cross-indicator divergence and convergence analysis intuitive. The MACD features a dynamic scaling algorithm for consistent visual representation across different instruments and timeframes.
Enhanced Visual Signals:
Crossover Highlights: Stoch RSI and KDJ feature colored fills between their lines during golden crosses (bullish) and death crosses (bearish).
Multi-Timeframe MACD: The MACD can be calculated on a different timeframe than your current chart, providing higher-timeframe context. Its histogram uses a sophisticated 4-color system for finer trend nuance.
Flexible Settings: Extensive input options for each indicator (lengths, sources, visibility) allow for deep customization to fit any trading style.
Ideal For: Spotting convergence/divergence, confirming entry/exit points with multiple indicators, and analyzing momentum across different timeframes.
中文简介
SCTI-RSK:多周期复合振荡指标
SCTI-RSK(智能复合技术指标 - 相对强弱与KDJ)是一款功能强大的一体化振荡器面板,专为依赖动量和超买超卖条件的交易者设计。它巧妙地将七种最流行的技术指标组合并归一化到一个统一的视图中,可实现快速高效的多因素市场分析。
核心功能:
统一振荡器视图: 集成了Stoch RSI、KDJ、RSI、CCI、Williams %R、MFI以及一个特别调整的MACD指标到一个易于阅读的窗口中,消除了图表干扰。
可定制显示: 可以单独切换每个指标的显示/隐藏,让您专注于对策略最重要的信号。
智能缩放与对齐: 所有振荡器均归一化到通用刻度(通常是0-100),使得跨指标的背离和共振分析一目了然。MACD采用动态缩放算法,确保在不同品种和时间周期上都能保持一致的视觉表现。
增强型视觉信号:
交叉高亮显示: Stoch RSI和KDJ在金叉(看涨)和死叉(看跌)时,线之间会填充颜色。
多周期MACD: MACD可以在与当前图表不同的时间周期上进行计算,提供更高时间周期的上下文。其直方图采用复杂的四色系统来显示更精细的趋势变化。
灵活的设置: 每个指标都有丰富的输入选项(长度、数据源、可见性),允许深度自定义以适应任何交易风格。
适用场景: 识别共振/背离,通过多个指标确认入场/出场点,以及分析不同时间周期的动量。
Sürüm Notları
🧾 SCTI-RSK Indicator Introduction (English)Overview
SCTI-RSK is a comprehensive multi-oscillator indicator designed for advanced technical analysis. It integrates multiple popular indicators into a single, highly customizable panel, allowing traders to visualize momentum, trend strength, and potential reversal points with clarity.
🔧 Key Features
Multiple Indicators in One: Includes Stoch RSI, KDJ, RSI, CCI, Williams %R, MFI, MACD, and the newly added Bias (Deviation Rate).
Fully Customizable: Each indicator can be shown or hidden individually to suit your trading style.
Visual Enhancements:
Cross signals with fill colors (e.g., golden cross/death cross).
Dynamic scaling for MACD and Bias to maintain visual consistency.
Clean, organized layout with grouped settings.
Bias Indicator Added: Measures the deviation of price from key EMAs (55, 144, 233) to identify overbought/oversold conditions.
🛠 Settings Overview
You can enable/disable the following indicators:
Stoch RSI
KDJ
RSI (short and mid-term)
CCI (short and mid-term)
Williams %R
MFI
MACD (with dynamic scaling)
Bias (with optional histogram and multiple EMA periods)
📈 Ideal For
Swing traders
Multi-timeframe analysts
Traders who prefer a consolidated view of momentum and trend indicators
📖 SCTI-RSK 指标介绍 (中文)
概述
SCTI-RSK 是一款综合型多振荡器指标,专为高级技术分析设计。它将多个常用指标集成在一个面板中,支持高度自定义,帮助交易者清晰识别动量、趋势强度及潜在反转点。
🔧 主要功能
多指标合一:包含 Stoch RSI、KDJ、RSI、CCI、Williams %R、MFI、MACD,以及新增的 Bias (乖离率)。
完全可定制:每个指标均可独立显示或隐藏,适应不同交易风格。
视觉增强:
金叉/死叉信号填充色
MACD 和 Bias 动态缩放,保持视觉一致性
设置分组,界面清晰易用
新增 Bias 指标:通过计算价格与关键EMA(55、144、233)的偏离程度,识别超买/超卖状态。
🛠 设置概览
可独立开关的指标包括:
Stoch RSI
KDJ
RSI(短期与中期)
CCI(短期与中期)
Williams %R
MFI
MACD(支持动态缩放)
Bias(可选柱状图,支持多周期EMA)
📈 适用场景
波段交易者
多时间框架分析者
喜欢集中查看动量与趋势指标的交易者
Sürüm Notları
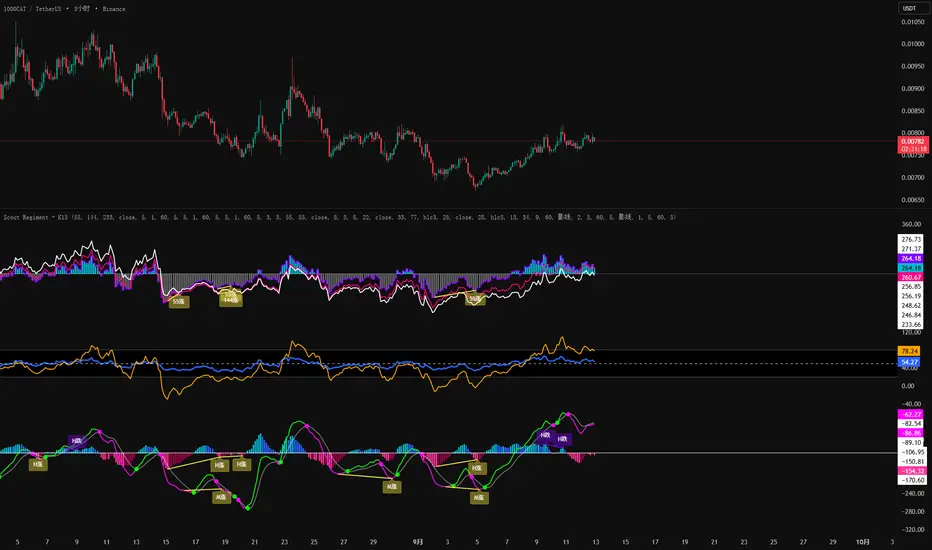
Scout Regiment - 多功能震荡指标 (SCTI-RSK)指标简介
Scout Regiment - K13 (SCTI-RSK) 是一款专为 TradingView 设计的强大综合指标,将多个流行震荡指标集于一身。它旨在帮助交易者从不同角度分析市场动量、超买/超卖状况以及趋势强弱。该指标提供高度可定制的选项,让您可以根据自己的交易风格和偏好进行调整。
主要功能
Stoch RSI 和 KDJ: 提供两种流行的随机指标,用于识别超买/超卖区域和潜在的趋势反转信号。您可以独立启用或禁用 K、D、J 线,并开启金叉/死叉填充,使信号更加直观。
RSI 和 CCI: 集成经典相对强弱指数 (RSI) 和商品通道指数 (CCI),并提供短期和中期两种参数,帮助您更好地捕捉不同时间周期内的动量变化。
Williams %R 和 MFI: 包含 Williams %R (威廉姆斯百分比) 和 MFI (资金流向指数),这两者常用于衡量市场动量和资金流动,作为超买/超卖信号的补充。
MACD: 经典的 MACD 指标,支持自定义周期和多周期分析。该版本特别之处在于提供了动态缩放功能,并能在 MACD 线与信号线交叉时显示圆点,同时直方图颜色会根据动量变化自动调整。
乖离率 (Bias): 计算价格与多条 EMA 的乖离率,默认使用了斐波那契数列中的 55、144 和 233 作为 EMA 周期。该功能可帮助您衡量当前价格相对于长期趋势的偏离程度,并以柱状图形式直观显示。
使用说明
在指标设置中,您可以轻松控制每个模块的显示与隐藏:
基础指标设置:
通过勾选或取消勾选,一键控制 Stoch RSI、KDJ、RSI、CCI、Williams %R、MFI、MACD 和 Bias 的显示。
Stoch RSI、KDJ、RSI 等模块:
在各自的设置分组中,您可以调整指标的周期长度、信号线平滑度、数据源等参数。
部分模块(如 Stoch RSI 和 KDJ)还提供了金叉/死叉填充选项,以更好地突出潜在的交易信号。
MACD 和 Bias 模块:
MACD: 支持更改 EMA 周期和信号线周期。您可以选择使用当前图表周期或自定义其他周期进行计算,并可独立控制 MACD 线、信号线、直方图和交叉点的显示。
Bias (乖离率): 您可以调整 EMA 的周期,并选择是否显示基于 EMA55 的乖离率柱状图,以直观了解价格偏离情况。
Scout Regiment - All-in-One Oscillator (SCTI-RSK)
Indicator Description
Scout Regiment - K13 (SCTI-RSK) is a powerful, all-in-one indicator for TradingView that combines multiple popular oscillators into a single tool. It is designed to help traders analyze market momentum, identify overbought/oversold conditions, and gauge trend strength from different perspectives. The indicator offers highly customizable options, allowing you to tailor it to your specific trading style and preferences.
Key Features
Stoch RSI & KDJ: Provides two popular stochastic indicators to identify overbought/oversold zones and potential trend reversal signals. You can enable or disable the K, D, and J lines independently and activate Golden/Death Cross fills for more intuitive signals.
RSI & CCI: Integrates the classic Relative Strength Index (RSI) and Commodity Channel Index (CCI), with options for both short-term and mid-term parameters to help you capture momentum shifts across different timeframes.
Williams %R & MFI: Includes Williams %R and the Money Flow Index (MFI), which are often used to measure market momentum and capital flow, serving as complementary overbought/oversold signals.
MACD: A classic MACD indicator with customizable periods and multi-timeframe analysis. This version features dynamic scaling, displays dots on MACD line crossovers, and automatically changes histogram colors based on momentum shifts.
Bias: Calculates the price deviation from multiple EMAs, defaulting to Fibonacci sequence periods of 55, 144, and 233. This feature helps you measure the current price's deviation from its long-term trend, visualized with a histogram.
How to Use
You can easily control the visibility of each module in the indicator's settings:
Basic Indicator Settings:
Check or uncheck the boxes to control the visibility of Stoch RSI, KDJ, RSI, CCI, Williams %R, MFI, MACD, and Bias with a single click.
Stoch RSI, KDJ, RSI, etc. Modules:
In their respective settings groups, you can adjust the indicator's period lengths, signal line smoothing, and data source.
Some modules (like Stoch RSI and KDJ) also offer Golden/Death Cross fill options to highlight potential trading signals more effectively.
MACD & Bias Modules:
MACD: Supports changing EMA and signal line periods. You can choose to use the current chart timeframe or a custom one for calculations and independently control the visibility of the MACD line, signal line, histogram, and crossover dots.
Bias: You can adjust the EMA periods and choose whether to display the Bias histogram based on EMA55, providing a visual representation of price deviation.
Sürüm Notları
Scout Regiment - K13Sürüm Notları
Scout Regiment - K13: All-in-One Multi-Timeframe Oscillator DashboardThe Scout Regiment - K13 is a comprehensive and highly customizable multi-oscillator technical analysis tool designed for TradingView. It integrates and normalizes nine popular momentum and trend-following indicators into a single, cohesive panel below your chart, allowing for efficient multi-factor market analysis.
Core Features & Indicators:
Stoch RSI: Features smoothed %K and %D lines with customizable lengths. Includes visual cross alerts with dynamic fill colors between the lines for bullish (cyan) and bearish (white) crosses.
KDJ: Displays K, D, and J lines with optional fills highlighting golden and death crosses.
RSI: Plots dual RSI lines (short-term and medium-term) for multi-timeframe momentum assessment.
CCI: Plots dual CCI lines (standard and mid-length), normalized for easy comparison with other oscillators.
Williams %R: A classic overbought/oversold oscillator.
MFI (Money Flow Index): A volume-weighted RSI alternative.
MACD (Featured): A highly advanced and customizable MACD implementation.
Dynamic Scaling: Automatically adjusts the MACD histogram and line amplitudes for consistent visual presentation across different instruments and timeframes.
MA Type Selection: Choose between SMA or EMA for both the MACD and Signal lines.
Divergence Detection: Comprehensive bullish/bearish divergence detection for both the MACD line and the histogram, with configurable lookback periods and visual labels.
Flexible Visualization: Toggle lines, histogram, cross dots, and color changes.
Bias (Deviation Rate): Calculates and visualizes the percentage deviation of price from key EMAs (55, 144, 233). Features a dynamically scaled histogram based on the 55-period EMA for immediate visual impact.
Key Advantages:
Unified Scale: All indicators are normalized or scaled to fit a 0-100 (or similar) band, making confluence and divergence between different indicators exceptionally clear.
Complete Customization: Every indicator can be shown or hidden independently via intuitive input options, preventing clutter and allowing you to focus on your preferred tools.
Enhanced Visualization: Utilizes fills, color-changing lines, and dynamic scaling to make signals and trends more visually apparent.
Multi-Timeframe Analysis: The MACD can be set to calculate on a different timeframe than the current chart, adding a powerful layer of analysis.
Ideal For: Traders who use oscillator confluence for entry/exit decisions, those who want to avoid indicator overload by consolidating tools into one pane, and analysts seeking a powerful, all-in-one momentum dashboard.
Simply add it to your chart, configure the visibility of the indicators you use most, and begin your market reconnaissance.
中文介绍:
Scout Regiment - K13:多周期振荡器综合仪表盘
Scout Regiment - K13 是一款功能全面、高度可定制的多振荡器技术分析工具,专为 TradingView 设计。它将九种常用的动量和趋势跟踪指标整合并标准化到一个统一的面板中,位于主图下方,可实现高效的多因素市场分析。
核心功能与指标:
Stoch RSI: 提供平滑的 %K 和 %D 线,长度可调。包含视觉交叉警报,金叉(青色)和死叉(白色)时线之间会动态填充颜色。
KDJ: 显示 K、D、J 线,并可选填充色突出金叉和死叉。
RSI: 绘制双 RSI 线(短期和中期),用于多周期动量评估。
CCI: 绘制双 CCI 线(标准和中期长度),经过标准化以便与其他振荡器轻松比较。
Williams %R: 经典的超买/超卖振荡器。
MFI (资金流量指数): 加权成交量的 RSI 替代指标。
MACD (特色功能): 高度先进且可定制的 MACD 实现。
动态缩放: 自动调整 MACD 柱状图和线的振幅,确保在不同品种和时间周期上保持一致的视觉表现。
均线类型选择: 可为 MACD 线和信号线选择 SMA 或 EMA。
背离检测: 全面的 MACD 线和柱状图的看涨/看跌背离检测,具有可配置的回溯周期和视觉标签。
灵活可视化: 可切换线、柱状图、交叉点和颜色变化。
Bias (乖离率): 计算并可视化价格相对于关键 EMA(55, 144, 233)的百分比偏差。提供基于 55 周期 EMA 的动态缩放柱状图,直观显示偏离程度。
主要优势:
统一尺度: 所有指标均被标准化或缩放以适应 0-100(或类似)的波段,使得不同指标之间的协同和背离异常清晰。
完全自定义: 每个指标都可以通过直观的输入选项独立显示或隐藏,避免界面杂乱,让您专注于首选的工具。
增强的可视化: 利用填充、变色线和动态缩放使信号和趋势更加直观。
多周期分析: MACD 可设置为与当前图表不同的时间周期进行计算,增加了强大的分析维度。
适用人群: 使用振荡器协同效应作为入场/出场决策依据的交易者、希望通过将工具整合到一个面板来避免指标超载的用户,以及寻求功能强大的一体化动量分析仪表的分析师。
只需将其添加到您的图表中,配置您最常用指标的可见性,即可开始您的市场侦察。
Sürüm Notları
Scout Regiment - K13: All-in-One Multi-Timeframe Oscillator DashboardThe "Scout Regiment - K13" is a comprehensive multi-oscillator technical analysis indicator designed for TradingView. It integrates nine popular oscillators into a single, unified panel with a clean, non-cluttered visual design, allowing traders to analyze multiple momentum and trend-strength factors simultaneously.
Key Features:
Multiple Oscillators: Includes Stoch RSI, KDJ, RSI (with dual periods), CCI (with dual periods), Williams %R, MFI, MACD (with advanced features), and a unique multi-period Bias indicator.
Smart Visualization: All oscillators are intelligently scaled and aligned to fit a standardized 0-100 (or adjusted) scale, making cross-indicator analysis intuitive.
Customizable Display: Easily show or hide any oscillator via input settings to avoid clutter and focus on your preferred tools.
Enhanced MACD: Features a dynamically scaled MACD for consistent visual representation, along with detailed divergence detection for both the MACD line and histogram.
Crossover Highlights: Clear visual fills highlight golden crosses and death crosses on the Stoch RSI and KDJ indicators.
Multi-Timeframe Analysis: The MACD can be calculated based on the current chart timeframe or a user-defined different timeframe for broader analysis.
Bias Indicator: Calculates and displays the percentage deviation (Bias) of price from key EMAs (55, 144, 233), providing insights into trend extremity and potential mean reversion zones.
Ideal For: Traders who utilize confluence from multiple indicators but want a clean, organized chart layout. It's particularly useful for quickly assessing overall market momentum and spotting potential reversal signals through divergence and crossover events.
Usage Tips: Start by enabling only 2-3 of your favorite oscillators. Look for agreement between signals (e.g., oversold conditions on RSI, Stoch RSI, and Williams %R) for higher probability trades. Use the MACD divergences for early warning signs of potential trend weakness.
中文介绍:
Scout Regiment - K13:多时间框架振荡器综合仪表盘
"Scout Regiment - K13" 是一款为 TradingView 设计的综合性多振荡器技术分析指标。它将九种流行的振荡器集成到一个单一、统一的面板中,具有清晰简洁的可视化设计,允许交易者同时分析多个动量和趋势强度因素。
主要特点:
多振荡器集成: 包含 Stoch RSI、KDJ、RSI(双周期)、CCI(双周期)、Williams %R、MFI、MACD(高级功能)以及独特的 multi-period 乖离率 (Bias) 指标。
智能可视化: 所有振荡器都经过智能缩放和调整,以适应标准化的 0-100(或调整后的)刻度,使得指标间的对比分析非常直观。
可定制显示: 通过输入设置轻松显示或隐藏任何振荡器,避免界面杂乱,专注于您首选的分析工具。
增强型 MACD: 具备动态缩放功能的 MACD,确保视觉表现的一致性,并提供详细的 MACD 线和直方图的背离检测。
交叉点高亮: 清晰的颜色填充区域突显 Stoch RSI 和 KDJ 指标的金叉和死叉信号。
多时间框架分析: MACD 可以根据当前图表时间框架或用户自定义的不同时间框架进行计算,便于进行更广泛的分析。
乖离率 (Bias) 指标: 计算并显示价格相对于关键 EMA(55, 144, 233)的百分比偏差,为了解趋势极端程度和潜在均值回归区域提供 insights(洞察)。
适用人群: 适合那些使用多指标共振进行交易,但又希望图表布局干净整洁的交易者。它对于快速评估整体市场动量以及通过背离和交叉事件发现潜在反转信号特别有用。
使用提示: 开始时可以先只启用 2-3 个您最常用的振荡器。寻找信号之间的一致性(例如,RSI、Stoch RSI 和 Williams %R 同时出现超卖状况)以提高交易概率。使用 MACD 背离作为潜在趋势减弱的早期预警信号。
Sürüm Notları
SCTI-RSKAçık kaynak kodlu komut dosyası
Gerçek TradingView ruhuyla, bu komut dosyasının mimarı, yatırımcıların işlevselliğini inceleyip doğrulayabilmesi için onu açık kaynaklı hale getirdi. Yazarı tebrik ederiz! Ücretsiz olarak kullanabilseniz de, kodu yeniden yayınlamanın Topluluk Kurallarımıza tabi olduğunu unutmayın.
Feragatname
Bilgiler ve yayınlar, TradingView tarafından sağlanan veya onaylanan finansal, yatırım, alım satım veya diğer türden tavsiye veya öneriler anlamına gelmez ve teşkil etmez. Kullanım Koşulları bölümünde daha fazlasını okuyun.
Açık kaynak kodlu komut dosyası
Gerçek TradingView ruhuyla, bu komut dosyasının mimarı, yatırımcıların işlevselliğini inceleyip doğrulayabilmesi için onu açık kaynaklı hale getirdi. Yazarı tebrik ederiz! Ücretsiz olarak kullanabilseniz de, kodu yeniden yayınlamanın Topluluk Kurallarımıza tabi olduğunu unutmayın.
Feragatname
Bilgiler ve yayınlar, TradingView tarafından sağlanan veya onaylanan finansal, yatırım, alım satım veya diğer türden tavsiye veya öneriler anlamına gelmez ve teşkil etmez. Kullanım Koşulları bölümünde daha fazlasını okuyun.