OPEN-SOURCE SCRIPT
Güncellendi Pre-Market High & Low
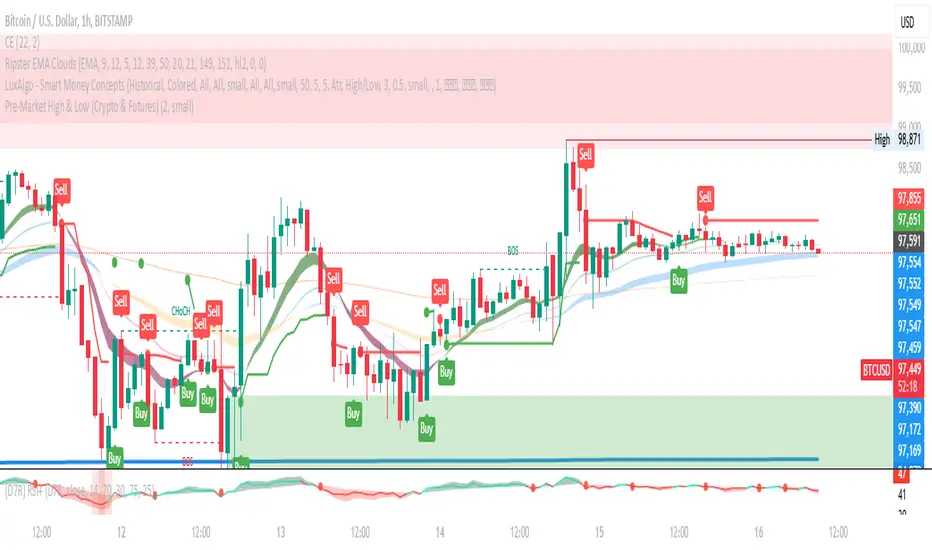
Indicator: Pre-Market High & Low
This indicator tracks the high and low price levels of a stock during the pre-market session (4:00 AM - 9:30 AM EST), before the official market open. It dynamically updates during pre-market hours, identifying the highest and lowest prices reached. Once the pre-market session ends, these levels are saved and plotted on the chart as reference points for the regular market session.
Key Features:
Dynamic Updates: Continuously tracks the high and low during pre-market hours.
Visual Indicators: Plots horizontal lines representing the pre-market high (green) and low (red).
Post-Market Reference: Once pre-market ends, these levels remain visible for the regular market session as reference points for potential breakout or breakdown levels.
How to Use:
Use this indicator to identify potential breakout or breakdown levels that may happen at the market open.
The green line represents the highest price reached during pre-market, while the red line indicates the lowest price.
The indicator will stop updating once the pre-market session closes (9:30 AM EST) and will remain visible as reference levels throughout the trading day.
Ideal for:
Day traders looking for pre-market support and resistance levels.
Traders analyzing the initial market reaction based on pre-market price action.
Sürüm Notları
Title: Pre-Market High & Low Indicator (Crypto & Futures)Description:
This indicator tracks the pre-market high and low for assets including cryptocurrencies and futures (e.g., ES1!, NQ1!). It monitors price movements from 00:00 ET to 09:30 ET, marking the high and low levels for the session.
Pre-market range: Displayed after 09:30 ET.
Color-coded levels:
Green if the pre-market high is above the previous day's high.
Red if the pre-market low is below the previous day's low.
Blue otherwise.
Customizable settings: Adjust line thickness and label font size.
Dynamic updates: Levels refresh automatically based on the pre-market session.
Ideal for traders analyzing market trends before the official trading session begins. 🚀
Açık kaynak kodlu komut dosyası
Gerçek TradingView ruhuyla, bu komut dosyasının mimarı, yatırımcıların işlevselliğini inceleyip doğrulayabilmesi için onu açık kaynaklı hale getirdi. Yazarı tebrik ederiz! Ücretsiz olarak kullanabilseniz de, kodu yeniden yayınlamanın Topluluk Kurallarımıza tabi olduğunu unutmayın.
Feragatname
Bilgiler ve yayınlar, TradingView tarafından sağlanan veya onaylanan finansal, yatırım, alım satım veya diğer türden tavsiye veya öneriler anlamına gelmez ve teşkil etmez. Kullanım Koşulları bölümünde daha fazlasını okuyun.