OPEN-SOURCE SCRIPT
Güncellendi [AA] - Market Valuation (Mean Based)
[AA] - Market Valuation (Mean Based)
What it does
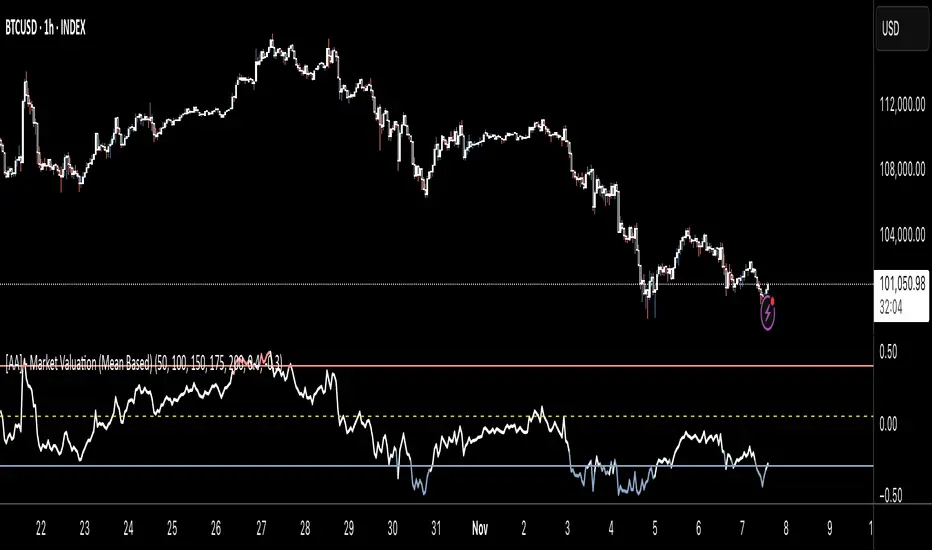
This indicator estimates whether price is overvalued, undervalued, or fairly valued relative to its structural mean across multiple lookback windows. It builds a single normalized oscillator from short-, mid-, and long-term ranges so traders can quickly see when price is stretched away from equilibrium.
This is not a mashup of existing tools. It’s a custom mean-deviation model that aggregates multi-window range positioning into one score.
How it works (concepts)
For each lookback length (13, 25, 30, 50, 100, 200):
Range & midpoint:
Highest high H and lowest low L.
Structural midpoint Mid = (H + L)/2.
Normalized deviation:
Dev = (Close − Mid) / (H − L) → location of price within its own range.
Aggregation:
The oscillator z_struct is the average of the deviations from the five windows.
Result: a smoothed, dimensionless value (roughly −1 to +1 in typical markets) showing multi-horizon displacement from the mean.
Plots & levels
Oscillator (area): z_struct
Reference lines: +0.40 (OB), 0.00 (equilibrium), −0.30 (OS)
Coloring:
Red when z_struct > OB (extended above mean)
Blue when z_struct < OS (extended below mean)
White in between
Suggested use
Mean reversion context: Fade extremes in range-bound conditions; take profits into OB/OS.
Trend awareness: In strong trends, extremes can persist—use levels as exhaustion context rather than standalone entry.
Filter/confirm: Combine with your trend filter or structure tools to time pullbacks and avoid chasing extended moves.
Inputs
Lookbacks: 13, 25, 30, 50, 100, 200
Thresholds: OB = 0.40, OS = −0.30
Notes & limitations
Works on the current symbol/timeframe only; no security() calls and no repainting beyond normal bar completion.
In very tight or flat ranges (H ≈ L), normalized deviations can become sensitive; consider longer windows or higher timeframes.
This is an indicator, not a strategy. No signals are generated; use with risk management.
Originality statement
This script implements an original, multi-window mean-deviation aggregation. It does not replicate a built-in or a public indicator; its purpose is to quantify cross-horizon valuation in a single, normalized measure.
What it does
This indicator estimates whether price is overvalued, undervalued, or fairly valued relative to its structural mean across multiple lookback windows. It builds a single normalized oscillator from short-, mid-, and long-term ranges so traders can quickly see when price is stretched away from equilibrium.
This is not a mashup of existing tools. It’s a custom mean-deviation model that aggregates multi-window range positioning into one score.
How it works (concepts)
For each lookback length (13, 25, 30, 50, 100, 200):
Range & midpoint:
Highest high H and lowest low L.
Structural midpoint Mid = (H + L)/2.
Normalized deviation:
Dev = (Close − Mid) / (H − L) → location of price within its own range.
Aggregation:
The oscillator z_struct is the average of the deviations from the five windows.
Result: a smoothed, dimensionless value (roughly −1 to +1 in typical markets) showing multi-horizon displacement from the mean.
Plots & levels
Oscillator (area): z_struct
Reference lines: +0.40 (OB), 0.00 (equilibrium), −0.30 (OS)
Coloring:
Red when z_struct > OB (extended above mean)
Blue when z_struct < OS (extended below mean)
White in between
Suggested use
Mean reversion context: Fade extremes in range-bound conditions; take profits into OB/OS.
Trend awareness: In strong trends, extremes can persist—use levels as exhaustion context rather than standalone entry.
Filter/confirm: Combine with your trend filter or structure tools to time pullbacks and avoid chasing extended moves.
Inputs
Lookbacks: 13, 25, 30, 50, 100, 200
Thresholds: OB = 0.40, OS = −0.30
Notes & limitations
Works on the current symbol/timeframe only; no security() calls and no repainting beyond normal bar completion.
In very tight or flat ranges (H ≈ L), normalized deviations can become sensitive; consider longer windows or higher timeframes.
This is an indicator, not a strategy. No signals are generated; use with risk management.
Originality statement
This script implements an original, multi-window mean-deviation aggregation. It does not replicate a built-in or a public indicator; its purpose is to quantify cross-horizon valuation in a single, normalized measure.
Sürüm Notları
[AA] Market Valuation (Mean Based)What it does
This indicator estimates whether price is overvalued, undervalued, or near equilibrium relative to its structural mean across five rolling windows. It produces a single normalized oscillator that reflects how far price is from the midpoint of its recent ranges at multiple horizons.
How it works (concepts)
For each rolling window (Rolling Window 1..5), the script:
Computes the highest high (H) and lowest low (L).
Takes the structural midpoint: Mid = (H + L) / 2.
Measures the normalized deviation of the close from that midpoint:
Dev = (Close−Mid)/(H−L)
Aggregates the five deviations with an equal-weight average to form the oscillator z_struct.
z_struct is dimensionless (typically within ~−1 to +1) and summarizes multi-horizon displacement from the mean.
Plots & levels
Oscillator (line): z_struct plotted as a line (width 2).
Reference lines: +0.40 (Overbought), 0.00 (Equilibrium), −0.30 (Oversold).
Dynamic color:
Red when z_struct > OB (extended above mean)
Blue when z_struct < OS (extended below mean)
White otherwise
Suggested use
Mean-reversion context: In ranges, fade extremes or take profits into OB/OS.
Trend awareness: In trends, OB/OS can persist—use readings as exhaustion context rather than standalone signals.
Filtering: Use as a context filter alongside your entry method or structure tools.
Inputs
Rolling Window 1 (default 13)
Rolling Window 2 (25)
Rolling Window 3 (50)
Rolling Window 4 (100)
Rolling Window 5 (200)
OB (+0.40) and OS (−0.30) thresholds
Notes & limitations
Works on the current symbol/timeframe only; no request.security() calls and no lookahead.
Values can become sensitive when H ≈ L on very flat windows; consider longer windows or higher timeframes in such cases.
This is an indicator, not a strategy; it does not issue trade signals. Apply risk management.
Originality statement
This script implements an original multi-window mean-deviation aggregation to quantify cross-horizon valuation in a single normalized measure. It is not a mashup of existing indicators.
Açık kaynak kodlu komut dosyası
Gerçek TradingView ruhuyla, bu komut dosyasının mimarı, yatırımcıların işlevselliğini inceleyip doğrulayabilmesi için onu açık kaynaklı hale getirdi. Yazarı tebrik ederiz! Ücretsiz olarak kullanabilseniz de, kodu yeniden yayınlamanın Topluluk Kurallarımıza tabi olduğunu unutmayın.
Feragatname
Bilgiler ve yayınlar, TradingView tarafından sağlanan veya onaylanan finansal, yatırım, alım satım veya diğer türden tavsiye veya öneriler anlamına gelmez ve teşkil etmez. Kullanım Koşulları bölümünde daha fazlasını okuyun.