OPEN-SOURCE SCRIPT
Rivanews Setup - Riva-Keltner, Média Rock [xdecow]
This setup was created by Rivadavila S. Malheiros
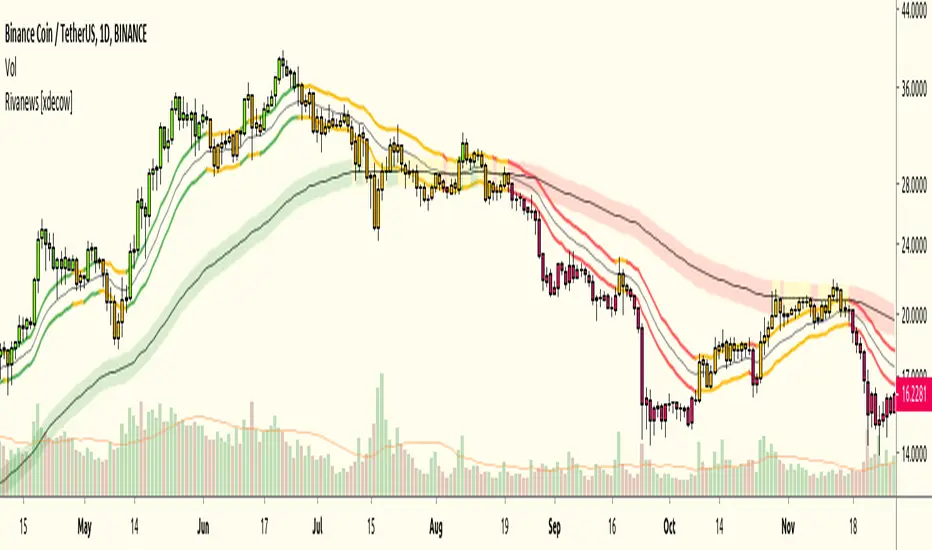
There are 2 Keltner Channels with exponential moving averages of 21 (riva) and 89 (rock) and ATR multiplier of 0.618.
When the price is between the bands, it is a sign of consolidation (yellow).
When the price is above the bands, it is an upward trend (green).
When the price is below the bands, it is a downward trend (red).
When the price crosses rock 89 and closes up / down, it may be a sign of a reversal. But it has a high probability of testing rock 89 again.
------------------------------------------------------------------------------------------
PT-BR
Este setup foi criado por Rivadavila S. Malheiros
São 2 Keltner Channels com médias móveis exponenciais de 21 (riva) e 89 (rock) e multiplicador do ATR de 0.618.
Quando o preço está entre as bandas, é sinal de consolidação (amarelo).
Quando o preço está acima das bandas, é uma tendencia de alta (verde).
Quando o preço está abaixo das bandas, é uma tendencia de baixa (vermelho).
Quando o preço cruza a rock 89 e fecha acima/abaixo, pode ser sinal de reversão. Mas tem uma alta probabilidade de testar a rock 89 novamente.
Açık kaynak kodlu komut dosyası
Gerçek TradingView ruhuyla, bu komut dosyasının mimarı, yatırımcıların işlevselliğini inceleyip doğrulayabilmesi için onu açık kaynaklı hale getirdi. Yazarı tebrik ederiz! Ücretsiz olarak kullanabilseniz de, kodu yeniden yayınlamanın Topluluk Kurallarımıza tabi olduğunu unutmayın.
Feragatname
Bilgiler ve yayınlar, TradingView tarafından sağlanan veya onaylanan finansal, yatırım, alım satım veya diğer türden tavsiye veya öneriler anlamına gelmez ve teşkil etmez. Kullanım Koşulları bölümünde daha fazlasını okuyun.