vdubus

VDUB_RejectionSpike_v1

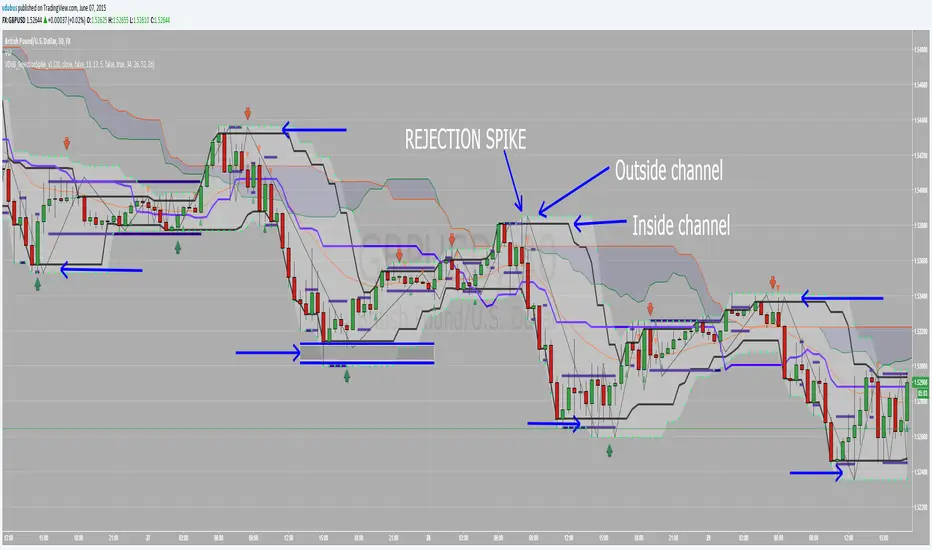
this indicator is for use with the Rejection Spike Strategy I recently publish
Have't had chance to test it yet so feel free to try.
Details of the strategy are listed in the link below

Açık kaynak kodlu komut dosyası

Gerçek TradingView ruhuyla, bu betiğin yazarı, yatırımcının anlayabilmesi ve doğrulayabilmesi için onu açık kaynak olarak yayınladı. Yazarın eline sağlık! Bunu ücretsiz olarak kullanabilirsiniz, ancak bu kodun bir yayında yeniden kullanımı Kullanım Koşulları ile yönetilir. Bir grafikte kullanmak için favorilere ekleyebilirsiniz.

Feragatname

Bilgiler ve yayınlar, TradingView tarafından sağlanan veya onaylanan finansal, yatırım, işlem veya diğer türden tavsiye veya tavsiyeler anlamına gelmez ve teşkil etmez. Kullanım Şartları'nda daha fazlasını okuyun.

Bu komut dosyasını bir grafikte kullanmak ister misiniz?
study(title="VDUB_RejectionSpike_v1", shorttitle="VDUB_RejectionSpike_v1", overlay=true)
//==============================inside channel===============================================//
len = input(20, minval=1, title="Length")
src = input(close, title="Source")
out = ema(src, len)
plot(out, title="EMA", color=red)
last8h = highest(close,13)
lastl8 = lowest(close, 13)

plot(last8h, color=black,style=line, linewidth=3)
plot(lastl8, color=black,style=line, linewidth=3)

bearish = cross(close,out) == 1 and close[1] > close 
bullish = cross(close,out) == 1 and close[1] < close 

plotshape(bearish, color=red, style=shape.triangledown, text="", location=location.abovebar)
plotshape(bullish, color=green, style=shape.triangleup, text="", location=location.belowbar)
//-------------LB Range---------------------------
channel=input(false, title="channel")
up = close<nz(up[1]) and close>down[1] ? nz(up[1]) : high
down = close<nz(up[1]) and close>down[1] ? nz(down[1]) : low
ul=plot(channel?up:up==nz(up[1])?up:na, color=navy, linewidth=4, style=linebr, title="Up")
ll=plot(channel?down:down==nz(down[1])?down:na, color=navy, linewidth=4, style=linebr, title="Down")
//==============================Outside channel===============================================//
length1 = input(13, minval=1, title="Upper Channel")
length2 = input(13, minval=1, title="Lower Channel")

upper = highest(length1)
lower = lowest(length2)

basis = avg(upper, lower)

l = plot(lower, style=circles, linewidth=2, color=lime)
u = plot(upper, style=circles, linewidth=2, color=lime)

fill(u, l, color=white, transp=75, title="Fill")
//============================zigzag======//
length = input(5)
showBasis = input(false)
hls = ema(hl2, length)

plot(not showBasis ? na : hls, color=black)
isRising = hls >= hls[1]

zigzag = isRising and not isRising[1] ? lowest(length) :  not isRising and isRising[1] ? highest(length) : na
plot(zigzag, color=black)
//============================Ichomku cloud
show_cloud = input(true, title="Display Ichimoku Cloud:")
conversionPeriods = input(34, minval=1)
basePeriods = input(26, minval=1)
laggingSpan2Periods = input(52, minval=1)
displacement = input(26, minval=1)

donchian(len) => avg(lowest(len), highest(len))

conversionLine = donchian(conversionPeriods)
baseLine = donchian(basePeriods)
leadLine1 = avg(conversionLine, baseLine)
leadLine2 = donchian(laggingSpan2Periods)

plot(not show_cloud ? na : conversionLine, color=blue,linewidth=3, style=line, title="Mid line resistance levels")
//plot(baseLine, color=red, title="Base Line")
//plot(close, offset = -displacement, color=green, title="Lagging Span")

p1 = plot(not show_cloud ? na : leadLine1, offset = displacement, color=green, title="Lead 1")
p2 = plot(not show_cloud ? na : leadLine2, offset = displacement, color=red, title="Lead 2")
fill(p1, p2)
//-------------------------------------------------------------