PROTECTED SOURCE SCRIPT
AR-Session-Orb-HTF H&L V5
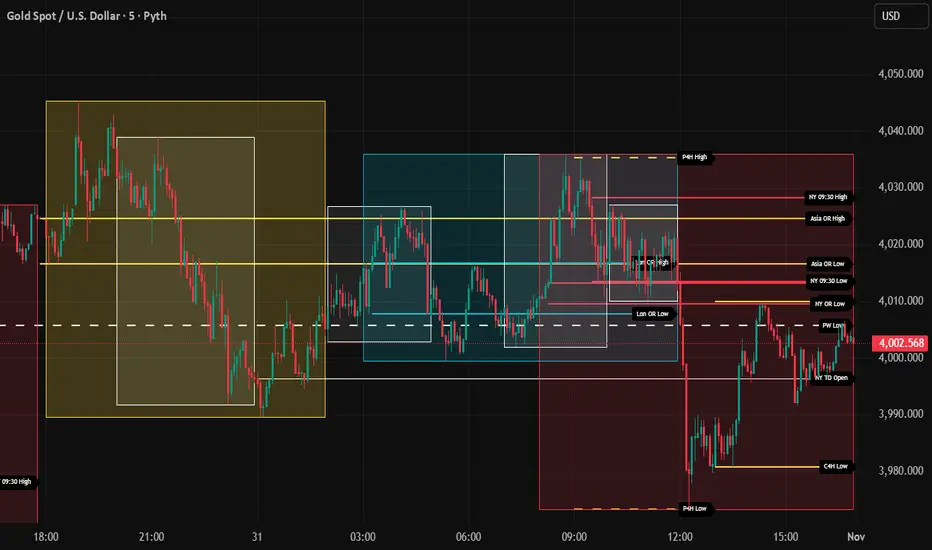
This indicator is built for intraday model execution around liquidity grabs, session timing, and higher-timeframe draw-on-liquidity. It maps out sessions, killzones, opening ranges (including the US 09:30 cash open), a daily NY “TD Open” line (00:00 → NY close), and key highs/lows from higher timeframes directly onto any lower timeframe chart (down to 1 minute).
________________________________________
1. Sessions (Asia / London / New York)
• Highlights the 3 main sessions with colored boxes:
• Asia
• London
• New York
• Default session times are set in New York local time:
• Asia: 18:00–02:00
• London: 03:00–12:00
• New York: 08:00–17:00
• You can change these times in the settings.
• Each box automatically expands as the session progresses.
Why it matters: these windows show you where liquidity usually builds, where the day “hands off” from Asia → London → NY, and when expansion/displacement typically happens.
________________________________________
2. ICT Killzones
The script includes 4 configurable killzones (NY local by default):
• Asia late session: 20:00–00:00
• London killzone: 02:00–05:00
• New York AM: 07:00–10:00
• New York Midday: 10:00–12:00
For each killzone you can:
• toggle on/off
• adjust the time window
• pick colors
This makes it easy to see when price is trading inside a high-probability delivery period, so you can line it up with liquidity above/below the session or OR.
________________________________________
3. Opening Range Levels
The indicator captures the high and low of the first X minutes (default 15) of each important window and projects those levels as horizontal lines.
It does this for:
• Asia Open Range
• London Open Range
• New York Open Range (08:00)
• NY 09:30 Cash-Open Range ✅
• (in the original idea: NY mid / second NY window)
Behavior:
• Asia OR → after the first X minutes of Asia, the high/low are projected across the rest of the trading day.
• London OR → taken from the London start, but extended only while London is active.
• NY OR (08:00) → taken from the start of the NY session and extended only during NY.
• NY 09:30 OR → this one is special. At exactly 09:30 (cash open) the script starts a second, independent OR for that day, using your chosen length (e.g. 15 minutes). When the window finishes, it freezes the 09:30 high and low and projects them horizontally all the way to the NY session end. You can style it separately (color, labels). This gives you a clean “cash-open dealing range” to watch for sweeps, fake-outs and continuations.
You can:
• choose the range length (1–60 minutes for 09:30, 1–30 for the others)
• show/hide each OR
• color each OR
• show labels such as “Asia OR High”, “Lon OR Low”, “NY 09:30 High”, etc.
• control line padding so labels don’t print on top of the candle
These ORs often become obvious liquidity pools, fail-break zones, or continuation triggers.
________________________________________
4. NY TD Open Line (Daily 00:00) ✅
On every trading day the script also plots a “TD” structure for New York:
• at 00:00 NY time it draws a vertical dashed line to mark the day’s start
• it records that day’s open price
• it then projects a horizontal line from 00:00 → all the way to NY session close (default 17:00)
• the horizontal line is labeled e.g. “NY TD Open”
How to use it:
• see instantly where current price is vs the daily open
• combine with 09:30 OR to know if cash open is opening above/below the day’s open
• good for intraday bias (above = bullish day structure, below = bearish day structure)
• nice anchor when you go down to 1m/3m
You can toggle the TD feature on/off and change its colors.
________________________________________
5. Previous Week High / Low
• Plots last week’s high and low on any timeframe
• Drawn as dashed lines with padding (so they don’t run to infinity)
• Each level is labeled (default “PW High” / “PW Low”)
These are classic weekly liquidity magnets and very useful when London/NY is expanding into an old weekly extreme.
________________________________________
6. Monthly High / Low
The script plots both:
• Previous month high/low
• Current month high/low (live)
Defaults:
• previous month → dashed + purple
• current month → solid + blue
You can change:
• line colors
• label text & colors
• how far the line should extend (bars span)
This gives you higher-TF liquidity targets on your intraday chart without switching to M or W.
________________________________________
7. 4H High / Low (Intra-session Liquidity Map)
On timeframes up to 4H, the script also plots:
• previous 4H high/low
• current 4H high/low
Important design choice: they only live inside their own 4H window.
• the previous 4H range is shown only over the previous 4H time span
• the current 4H range is shown only over the current 4H candle
That means you don’t get messy, stretched 4H lines across the whole day — only where they actually apply. This is super useful for London/NY raids on 4H highs/lows.
________________________________________
8. Customization / Inputs
Almost everything is editable:
• session windows + colors
• killzone windows + colors
• opening-range length
• ON/OFF per OR (Asia, London, NY 08:00, NY 09:30)
• label text, size, bg color, text color
• HTF line length (weekly / monthly)
• TD 00:00 ON/OFF + colors
• line end padding so labels don’t sit on the right edge
The idea is to give you structure, not signals.
________________________________________
How to Use
1. Start from the monthly / weekly / previous week levels to see where price “wants” to go.
2. Drop into the active session box / killzone to know when to pay attention.
3. Trade around opening-range highs/lows — especially the NY 09:30 OR — and look for liquidity sweeps.
4. Check where price is relative to the NY TD Open (00:00) to confirm intraday bias.
5. Refine entries using the 4H highs/lows that fall inside that session.
Result: you get a top-down liquidity map + intraday timing tool, all on one chart.
________________________________________
Notes
• All times are interpreted in the chart/session timezone — keep your chart on NY session if you want the defaults to match the description.
• TradingView has drawing limits; on very low timeframes far back in history, old drawings may recycle.
• Because 09:30 and TD are drawn every day, it’s normal to see more labels the further right you scroll.
________________________________________
Disclaimer
This script is for educational and charting purposes only.
It does not generate trade signals, manage risk, or guarantee profitability.
Trading involves risk — always do your own analysis.
Special Thanks to Sabo & Hive Community
________________________________________
1. Sessions (Asia / London / New York)
• Highlights the 3 main sessions with colored boxes:
• Asia
• London
• New York
• Default session times are set in New York local time:
• Asia: 18:00–02:00
• London: 03:00–12:00
• New York: 08:00–17:00
• You can change these times in the settings.
• Each box automatically expands as the session progresses.
Why it matters: these windows show you where liquidity usually builds, where the day “hands off” from Asia → London → NY, and when expansion/displacement typically happens.
________________________________________
2. ICT Killzones
The script includes 4 configurable killzones (NY local by default):
• Asia late session: 20:00–00:00
• London killzone: 02:00–05:00
• New York AM: 07:00–10:00
• New York Midday: 10:00–12:00
For each killzone you can:
• toggle on/off
• adjust the time window
• pick colors
This makes it easy to see when price is trading inside a high-probability delivery period, so you can line it up with liquidity above/below the session or OR.
________________________________________
3. Opening Range Levels
The indicator captures the high and low of the first X minutes (default 15) of each important window and projects those levels as horizontal lines.
It does this for:
• Asia Open Range
• London Open Range
• New York Open Range (08:00)
• NY 09:30 Cash-Open Range ✅
• (in the original idea: NY mid / second NY window)
Behavior:
• Asia OR → after the first X minutes of Asia, the high/low are projected across the rest of the trading day.
• London OR → taken from the London start, but extended only while London is active.
• NY OR (08:00) → taken from the start of the NY session and extended only during NY.
• NY 09:30 OR → this one is special. At exactly 09:30 (cash open) the script starts a second, independent OR for that day, using your chosen length (e.g. 15 minutes). When the window finishes, it freezes the 09:30 high and low and projects them horizontally all the way to the NY session end. You can style it separately (color, labels). This gives you a clean “cash-open dealing range” to watch for sweeps, fake-outs and continuations.
You can:
• choose the range length (1–60 minutes for 09:30, 1–30 for the others)
• show/hide each OR
• color each OR
• show labels such as “Asia OR High”, “Lon OR Low”, “NY 09:30 High”, etc.
• control line padding so labels don’t print on top of the candle
These ORs often become obvious liquidity pools, fail-break zones, or continuation triggers.
________________________________________
4. NY TD Open Line (Daily 00:00) ✅
On every trading day the script also plots a “TD” structure for New York:
• at 00:00 NY time it draws a vertical dashed line to mark the day’s start
• it records that day’s open price
• it then projects a horizontal line from 00:00 → all the way to NY session close (default 17:00)
• the horizontal line is labeled e.g. “NY TD Open”
How to use it:
• see instantly where current price is vs the daily open
• combine with 09:30 OR to know if cash open is opening above/below the day’s open
• good for intraday bias (above = bullish day structure, below = bearish day structure)
• nice anchor when you go down to 1m/3m
You can toggle the TD feature on/off and change its colors.
________________________________________
5. Previous Week High / Low
• Plots last week’s high and low on any timeframe
• Drawn as dashed lines with padding (so they don’t run to infinity)
• Each level is labeled (default “PW High” / “PW Low”)
These are classic weekly liquidity magnets and very useful when London/NY is expanding into an old weekly extreme.
________________________________________
6. Monthly High / Low
The script plots both:
• Previous month high/low
• Current month high/low (live)
Defaults:
• previous month → dashed + purple
• current month → solid + blue
You can change:
• line colors
• label text & colors
• how far the line should extend (bars span)
This gives you higher-TF liquidity targets on your intraday chart without switching to M or W.
________________________________________
7. 4H High / Low (Intra-session Liquidity Map)
On timeframes up to 4H, the script also plots:
• previous 4H high/low
• current 4H high/low
Important design choice: they only live inside their own 4H window.
• the previous 4H range is shown only over the previous 4H time span
• the current 4H range is shown only over the current 4H candle
That means you don’t get messy, stretched 4H lines across the whole day — only where they actually apply. This is super useful for London/NY raids on 4H highs/lows.
________________________________________
8. Customization / Inputs
Almost everything is editable:
• session windows + colors
• killzone windows + colors
• opening-range length
• ON/OFF per OR (Asia, London, NY 08:00, NY 09:30)
• label text, size, bg color, text color
• HTF line length (weekly / monthly)
• TD 00:00 ON/OFF + colors
• line end padding so labels don’t sit on the right edge
The idea is to give you structure, not signals.
________________________________________
How to Use
1. Start from the monthly / weekly / previous week levels to see where price “wants” to go.
2. Drop into the active session box / killzone to know when to pay attention.
3. Trade around opening-range highs/lows — especially the NY 09:30 OR — and look for liquidity sweeps.
4. Check where price is relative to the NY TD Open (00:00) to confirm intraday bias.
5. Refine entries using the 4H highs/lows that fall inside that session.
Result: you get a top-down liquidity map + intraday timing tool, all on one chart.
________________________________________
Notes
• All times are interpreted in the chart/session timezone — keep your chart on NY session if you want the defaults to match the description.
• TradingView has drawing limits; on very low timeframes far back in history, old drawings may recycle.
• Because 09:30 and TD are drawn every day, it’s normal to see more labels the further right you scroll.
________________________________________
Disclaimer
This script is for educational and charting purposes only.
It does not generate trade signals, manage risk, or guarantee profitability.
Trading involves risk — always do your own analysis.
Special Thanks to Sabo & Hive Community
Korumalı komut dosyası
Bu komut dosyası kapalı kaynak olarak yayınlanmaktadır. Ancak, özgürce ve herhangi bir sınırlama olmaksızın kullanabilirsiniz – daha fazla bilgi burada.
Feragatname
Bilgiler ve yayınlar, TradingView tarafından sağlanan veya onaylanan finansal, yatırım, işlem veya diğer türden tavsiye veya tavsiyeler anlamına gelmez ve teşkil etmez. Kullanım Şartları'nda daha fazlasını okuyun.