PROTECTED SOURCE SCRIPT
[DEM] Donchian Oscillator
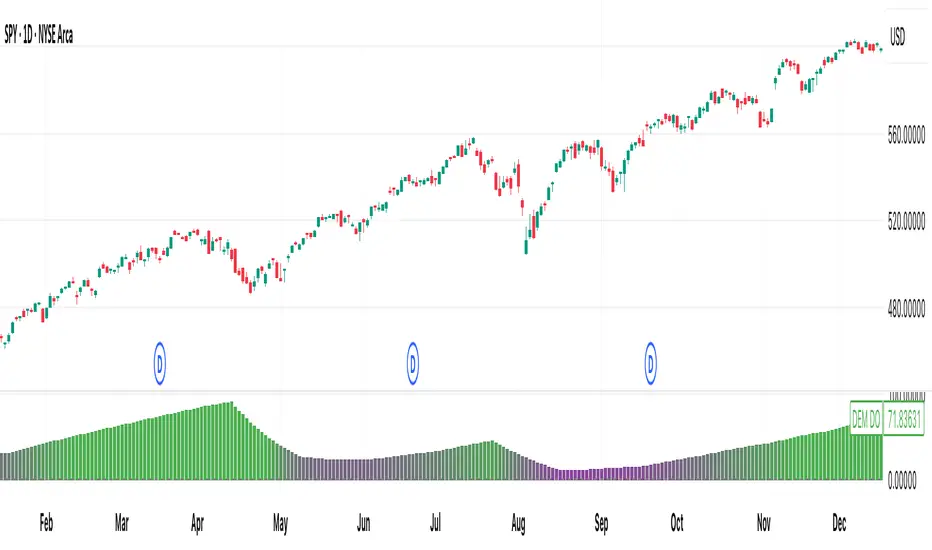
[DEM] Donchian Oscillator is designed to measure the relative position of recent price action within the Donchian Channel by calculating how many bars have passed since the most recent highest high versus the most recent lowest low over a specified lookback period. The indicator computes the difference between bars since the last low and bars since the last high, then applies smoothing using an RMA to create an oscillator that fluctuates around a zero centerline displayed in a separate pane below the main chart. The oscillator uses gradient coloring from red (negative values indicating recent lows dominate) through purple (neutral) to green (positive values indicating recent highs dominate), helping traders identify momentum shifts and potential overbought/oversold conditions based on whether price is closer to making new highs or new lows within the specified range.
Korumalı komut dosyası
Bu komut dosyası kapalı kaynak olarak yayınlanmaktadır. Ancak, ücretsiz ve herhangi bir sınırlama olmaksızın kullanabilirsiniz – daha fazla bilgiyi buradan edinebilirsiniz.
Feragatname
Bilgiler ve yayınlar, TradingView tarafından sağlanan veya onaylanan finansal, yatırım, alım satım veya diğer türden tavsiye veya öneriler anlamına gelmez ve teşkil etmez. Kullanım Koşulları bölümünde daha fazlasını okuyun.