PROTECTED SOURCE SCRIPT
Red Dog Reversal Pattern
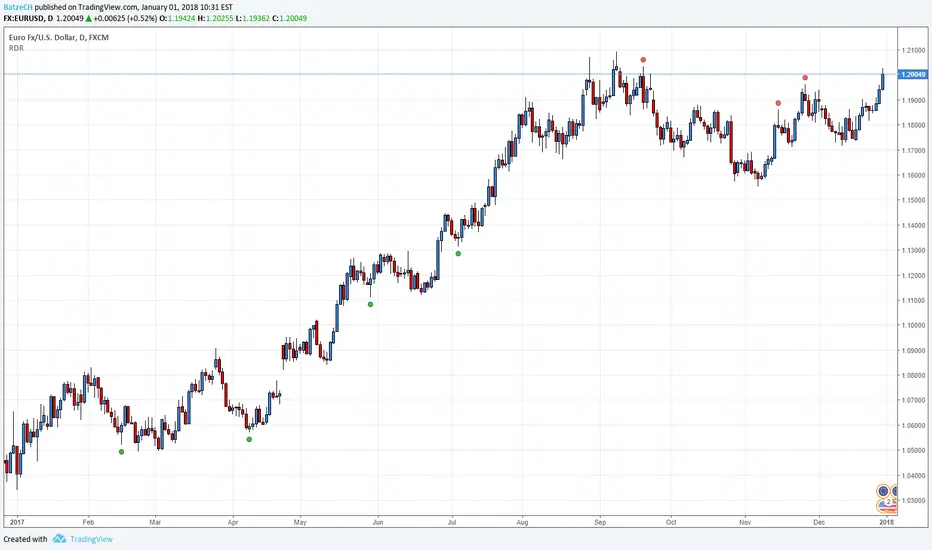
This indicator is a interpretation of the Red Dog Reversal Pattern which was discovered by T3Live founder Scott Redler. (AFAIK)
The indicator is maybe useful for Day Trade or Swing Trade.
BUY Criteria:
1. Stock is down for multiple days
2. Stock goes below prior day's low
3. Stock trades back up through prior day's low, which triggers the buy
4. The stop is set at the current intraday low
SELL Criteria:
1. Stock is up for multiple days
2. Stock goes above the prior day's high
3. Stock trades back down through prior day's high, which triggers the sell
4. The stop is set at the current intraday high
Please always remember, there is no holy grail indicator!
Korumalı komut dosyası
Bu komut dosyası kapalı kaynak olarak yayınlanmaktadır. Ancak, özgürce ve herhangi bir sınırlama olmaksızın kullanabilirsiniz – daha fazla bilgi burada.
Feragatname
Bilgiler ve yayınlar, TradingView tarafından sağlanan veya onaylanan finansal, yatırım, işlem veya diğer türden tavsiye veya tavsiyeler anlamına gelmez ve teşkil etmez. Kullanım Şartları'nda daha fazlasını okuyun.