OPEN-SOURCE SCRIPT
LEO EMA 9-13 DIFF
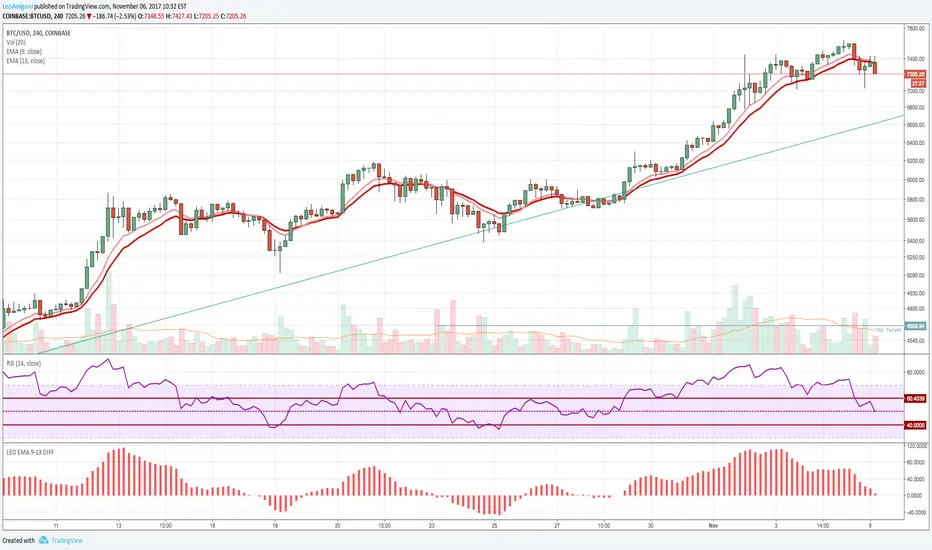
I made a public version of the private one that I made since I had so many requests.
Good indicator for buy and sell signals, better for buys usually works well on any timeframes. I use it on the 15m, 1hr, 4hr mostly.
You can plot the EMA's also on the chart to see the lines crossing but this indicator gives you a much easier read. It's very simple and basic all I do is plot the difference between the EMA 9 and the EMA 13. These values seem to give a very clear signal for entries and exits.
How to use.
- When the histogram becomes positive it's a buy signal when it becomes negative it's a sell signal.
- Note: Like any moving average this doesn't work well if you have a massive dip or a massive spike as the average will signal too late. but you should get some warning right before it happens.
Açık kaynak kodlu komut dosyası
Gerçek TradingView ruhuna uygun olarak, bu komut dosyasının oluşturucusu bunu açık kaynaklı hale getirmiştir, böylece yatırımcılar betiğin işlevselliğini inceleyip doğrulayabilir. Yazara saygı! Ücretsiz olarak kullanabilirsiniz, ancak kodu yeniden yayınlamanın Site Kurallarımıza tabi olduğunu unutmayın.
Feragatname
Bilgiler ve yayınlar, TradingView tarafından sağlanan veya onaylanan finansal, yatırım, işlem veya diğer türden tavsiye veya tavsiyeler anlamına gelmez ve teşkil etmez. Kullanım Şartları'nda daha fazlasını okuyun.