OPEN-SOURCE SCRIPT
Candlestick RS
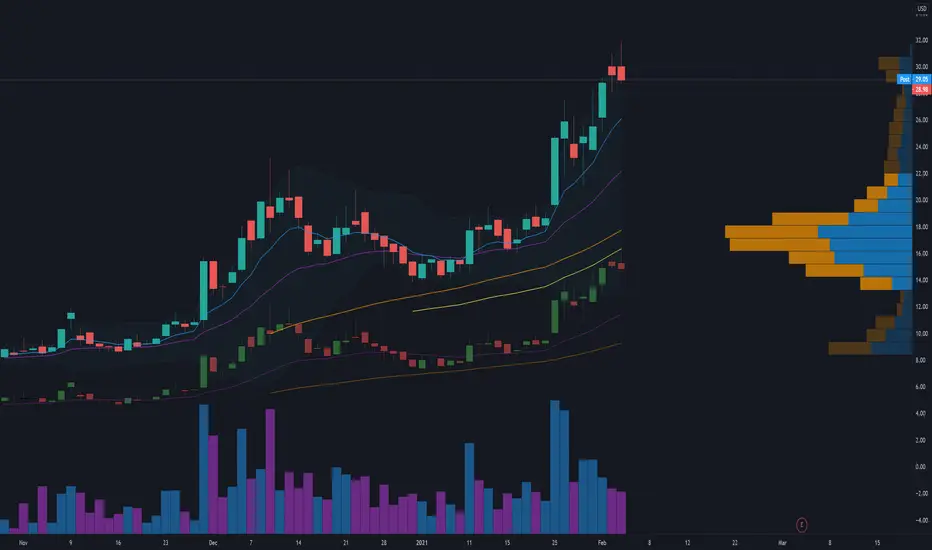
This is a candlestick charted Relative Strength indicator. It compares the chosen stock's progress compared to that of the SPY ETF ... ( SPY is used so it should hopefully update intraday). I use this indicator to see which stocks are outperforming the market.
Input Variable Descriptions:
Ratio: this variable is a float (0 to 1) that is basically how close the Candlestick RS is to the actual price action of the chart. (1.0 being right on top of it, 0.0 being as far away as possible from it)
Ballpark SPY price: this variable has to be constant, and due to the way pinescript works, you have to manually put in a ballpark of what SPY is at.
Neither of these variables influences the actual data of the indicator, but rather how it is shown on screen. It's difficult to describe, so I recommend you messing around with the variables and see what changes.
Hope this helps, I find this useful, so I figured I'd publish this... This is my first pine script so forgive me for any errors, just want to help :)
Açık kaynak kodlu komut dosyası
Gerçek TradingView ruhuyla, bu komut dosyasının mimarı, yatırımcıların işlevselliğini inceleyip doğrulayabilmesi için onu açık kaynaklı hale getirdi. Yazarı tebrik ederiz! Ücretsiz olarak kullanabilseniz de, kodu yeniden yayınlamanın Topluluk Kurallarımıza tabi olduğunu unutmayın.
Feragatname
Bilgiler ve yayınlar, TradingView tarafından sağlanan veya onaylanan finansal, yatırım, alım satım veya diğer türden tavsiye veya öneriler anlamına gelmez ve teşkil etmez. Kullanım Koşulları bölümünde daha fazlasını okuyun.