OPEN-SOURCE SCRIPT
Stock Highs Tracker
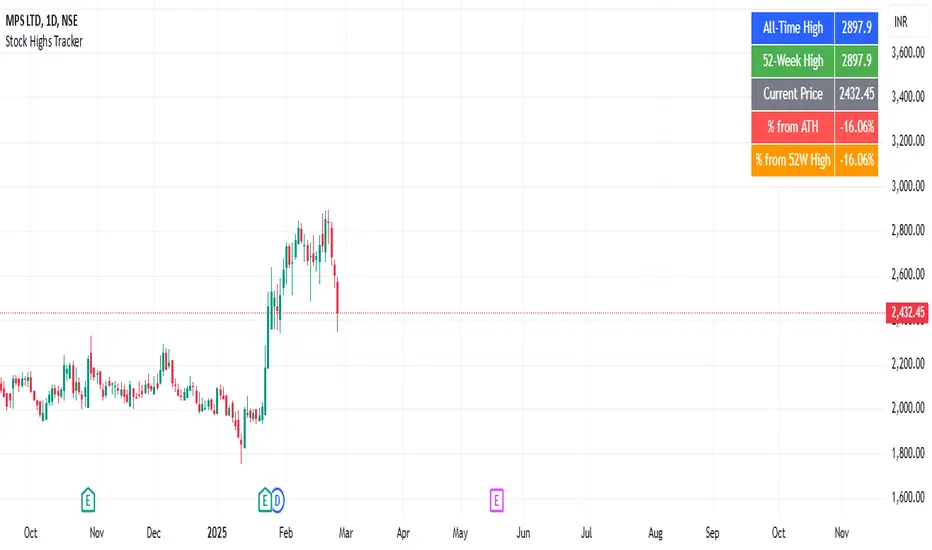
This indicator tracks key stock price levels including the all-time high (ATH), 52-week high, and current price.
It calculates the percentage difference of the current price from both the ATH and 52-week high.
The data is displayed in a table at the top-right corner of the chart, allowing traders to quickly assess the stock’s performance relative to its historical highs.
This is useful for identifying stocks trading near their highs or experiencing significant pullbacks.
Açık kaynak kodlu komut dosyası
Gerçek TradingView ruhuyla, bu komut dosyasının mimarı, yatırımcıların işlevselliğini inceleyip doğrulayabilmesi için onu açık kaynaklı hale getirdi. Yazarı tebrik ederiz! Ücretsiz olarak kullanabilseniz de, kodu yeniden yayınlamanın Topluluk Kurallarımıza tabi olduğunu unutmayın.
Feragatname
Bilgiler ve yayınlar, TradingView tarafından sağlanan veya onaylanan finansal, yatırım, alım satım veya diğer türden tavsiye veya öneriler anlamına gelmez ve teşkil etmez. Kullanım Koşulları bölümünde daha fazlasını okuyun.