OPEN-SOURCE SCRIPT
Güncellendi Ichimoku Peeks
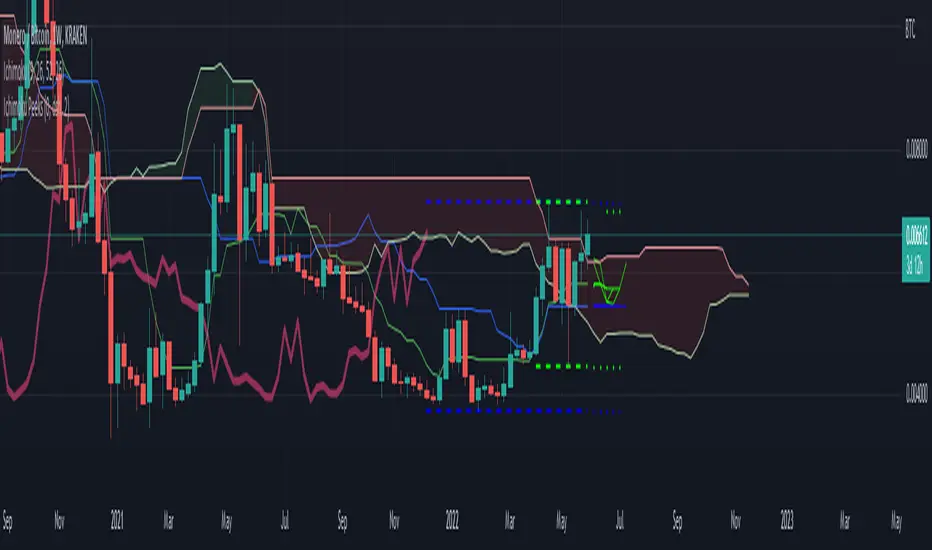
This indicator uses the Ichimoku Tenkan / Kijun trend line formulas to predict what those values will be in the future if current price action does not violate the period highs and lows.
Because of the way Ichimoku formulates the trend, it contains (but does not visualize) this predictive information in a way that moving averages do not.
Sharp chart readers can infer upcoming changes by counting back candles, but the process can be automated, as I've shown here.
This description does not seem to be editable so implementation details and usage will be covered in code commentary.
Sürüm Notları
* Fixed first prediction not rendering in some configs.* Added input boundary lines to show where calculation data is pulled from (off by default).
* Minor config organization.
Sürüm Notları
* Bugfix for visual artifacts. History of first projection was displayed in simple mode as infinite cross tail.* Adjusted "input boundary" diagnostic so that it more coherently relates to the projections. Now first projection drops last candle in channel.
Sürüm Notları
In this update:* More code commentary about usage and theory.
* Input boundaries are now on by default and configurable.
* Input boundaries are extended by default into projected range via `Show Highs/Lows` option.
Sürüm Notları
* Minor comment update to replace preview chart.Sürüm Notları
Documentation and preview update.Sürüm Notları
* Added built in Ichimoku via (lib-hlm)* Removed later projections due to less confidence and to make room for Ichimoku.
* Documentation updates.
* Option to fill in the boundary zones.
Açık kaynak kodlu komut dosyası
Gerçek TradingView ruhuyla, bu komut dosyasının mimarı, yatırımcıların işlevselliğini inceleyip doğrulayabilmesi için onu açık kaynaklı hale getirdi. Yazarı tebrik ederiz! Ücretsiz olarak kullanabilseniz de, kodu yeniden yayınlamanın Topluluk Kurallarımıza tabi olduğunu unutmayın.
Feragatname
Bilgiler ve yayınlar, TradingView tarafından sağlanan veya onaylanan finansal, yatırım, alım satım veya diğer türden tavsiye veya öneriler anlamına gelmez ve teşkil etmez. Kullanım Koşulları bölümünde daha fazlasını okuyun.