OPEN-SOURCE SCRIPT
CM_Hourly Pivots
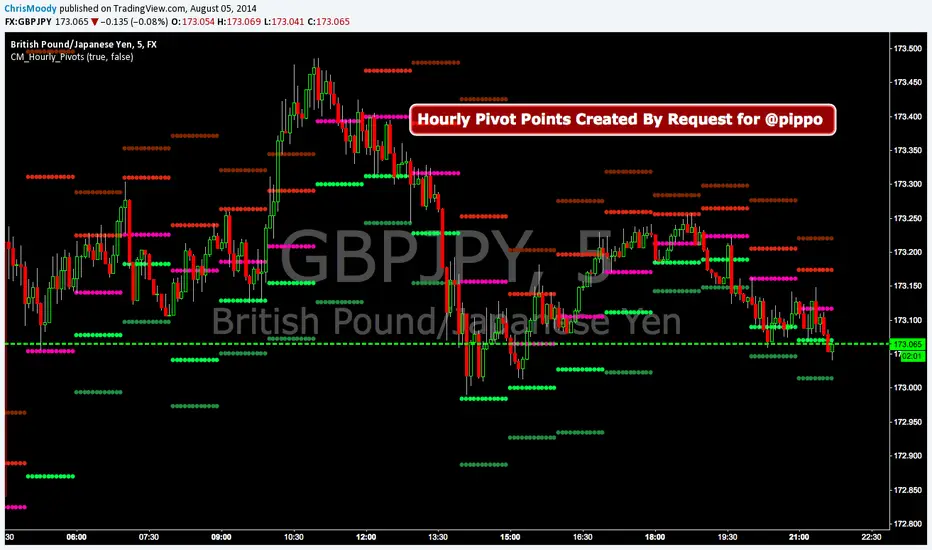
Simple Code for Hourly Pivot Points Requested by user pippo
Inputs Tab:
Turn On/Off Pivots
Turn On/Off R3/S3
Inputs Tab:
Turn On/Off Pivots
Turn On/Off R3/S3
Açık kaynak kodlu komut dosyası
Gerçek TradingView ruhuna uygun olarak, bu komut dosyasının oluşturucusu bunu açık kaynaklı hale getirmiştir, böylece yatırımcılar betiğin işlevselliğini inceleyip doğrulayabilir. Yazara saygı! Ücretsiz olarak kullanabilirsiniz, ancak kodu yeniden yayınlamanın Site Kurallarımıza tabi olduğunu unutmayın.
Coming Soon: ChrisMoodyTrading.com
Feragatname
Bilgiler ve yayınlar, TradingView tarafından sağlanan veya onaylanan finansal, yatırım, işlem veya diğer türden tavsiye veya tavsiyeler anlamına gelmez ve teşkil etmez. Kullanım Şartları'nda daha fazlasını okuyun.