PROTECTED SOURCE SCRIPT
Güncellendi Wolf Alerts Signals

Wolf Alerts Signals
This is an indicator of possible market entry.
Indicates with an arrow the direction and with a letter the intensity ("H" High or "L" Low).
Everything is calculated by comparing RSI and Volumes.
produced by zstiziano
This is an indicator of possible market entry.
Indicates with an arrow the direction and with a letter the intensity ("H" High or "L" Low).
Everything is calculated by comparing RSI and Volumes.
produced by zstiziano
Sürüm Notları
Adjustment of short values.Sürüm Notları
Update Sürüm Notları
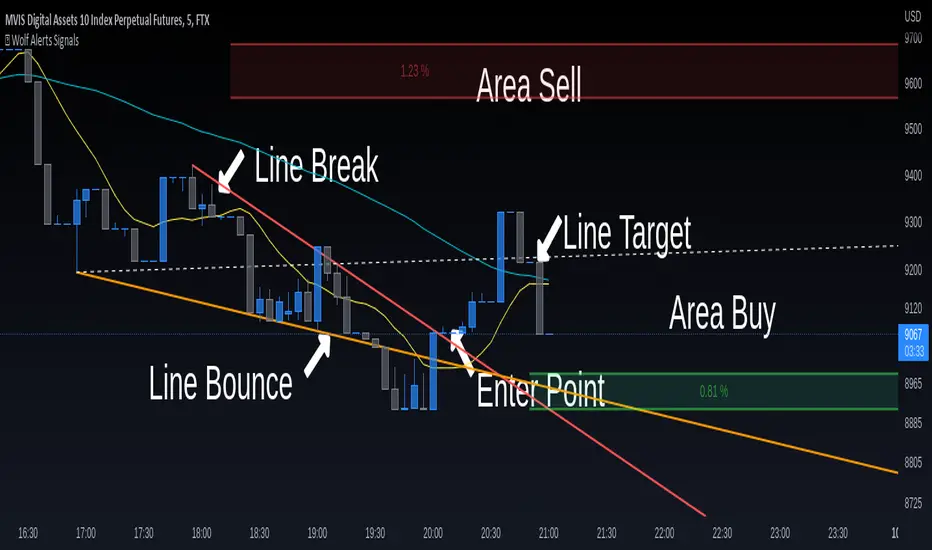
This indicator helps you find:- trend direction thanks to 3 moving averages
- breaking points of the trend lines
- buying and selling areas with the highest trade
- signals of too much sold or too much bought
Help this project with a small donation:
https://www.paypal.com/donate/?hosted_button_id=XFWT7XME5DRFE
Sürüm Notları
EXAMPLE LONG
EXAMPLE SHORT
▬▬▬▬▬▬▬▬▬▬▬▬▬▬▬▬▬▬▬▬▬▬▬▬▬▬▬▬▬▬▬▬▬▬▬
SUPPORT THIS PROJECT
▬▬▬▬▬▬▬▬▬▬▬▬▬▬▬▬▬▬▬▬▬▬▬▬▬▬▬▬▬▬▬▬▬▬▬
💰 [url= paypal.com/donate/?hosted_button_id=XFWT7XME5DRFE ] paypal.com/donate/?hosted_button_id=XFWT7XME5DRFE 💰
Sürüm Notları
fix bugSürüm Notları
- fix trend line- add line target
▬▬▬▬▬▬▬▬▬▬▬▬▬▬▬▬▬▬▬▬▬▬▬▬▬▬▬▬▬▬▬▬▬▬▬
SUPPORT THIS PROJECT
💰 DONATE WITH PAYPAL 💰
[url= paypal.com/donate/?hosted_button_id=XFWT7XME5DRFE ] paypal.com/donate/?hosted_button_id=XFWT7XME5DRFE ▬▬▬▬▬▬▬▬▬▬▬▬▬▬▬▬▬▬▬▬▬▬▬▬▬▬▬▬▬▬▬▬▬▬▬
Sürüm Notları
- added the possibility to choose whether to consider the shadow or not
Korumalı komut dosyası
Bu komut dosyası kapalı kaynak olarak yayınlanmaktadır. Ancak, ücretsiz ve herhangi bir sınırlama olmaksızın kullanabilirsiniz – daha fazla bilgiyi buradan edinebilirsiniz.
Feragatname
Bilgiler ve yayınlar, TradingView tarafından sağlanan veya onaylanan finansal, yatırım, alım satım veya diğer türden tavsiye veya öneriler anlamına gelmez ve teşkil etmez. Kullanım Koşulları bölümünde daha fazlasını okuyun.