PROTECTED SOURCE SCRIPT
Güncellendi Golden Pocket Channel [by vistahr]

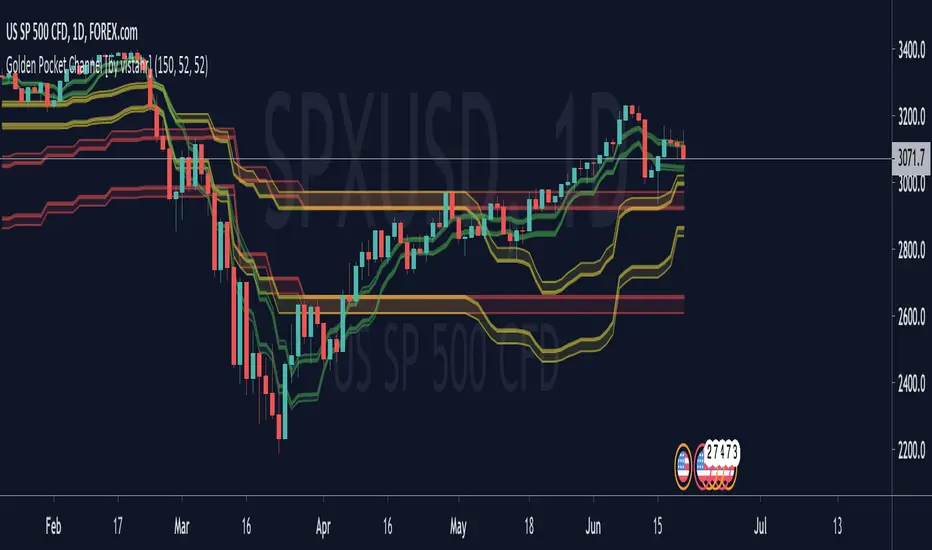
The indicator plots the golden pocket (Fibonacci retracement 61% to 65%) of recent highs and lows. The golden pocket is calculated from the last high to the last low. The high and low are determined by the number of last bars.
The golden pocket is used for trading as support and resistance.
The length of the past highs and lows can be determined by yourself. You can define three different lengths to find the highs and lows of the past.
The golden pocket is used for trading as support and resistance.
The length of the past highs and lows can be determined by yourself. You can define three different lengths to find the highs and lows of the past.
Sürüm Notları
The indicator plots the golden pocket ( Fibonacci retracement 61% to 65%) of recent highs and lows. The golden pocket is calculated from the last high to the last low. The high and low are determined by the number of last bars. The golden pocket is used for trading as support and resistance .
The length of the past highs and lows can be determined by yourself. You can define three different lengths to find the highs and lows of the past.
Update:
The GPs of the Hourly, Daily and Weekly are shown in all timeframes.
Korumalı komut dosyası
Bu komut dosyası kapalı kaynak olarak yayınlanmaktadır. Ancak, özgürce ve herhangi bir sınırlama olmaksızın kullanabilirsiniz – daha fazla bilgi burada.
Feragatname
Bilgiler ve yayınlar, TradingView tarafından sağlanan veya onaylanan finansal, yatırım, işlem veya diğer türden tavsiye veya tavsiyeler anlamına gelmez ve teşkil etmez. Kullanım Şartları'nda daha fazlasını okuyun.