Palgo Trading - Palgo
The "Palgo Trading - Palgo" indicator, developed by PALGOTRADING is a sophisticated technical analysis tool designed to identify potential buy and sell signals by combining trend analysis with momentum and optional AI-driven sentiment assessment. This indicator provides a clear visual representation of potential trading opportunities directly on the price chart.
At its core, the Palgo indicator synthesizes information from well-established technical analysis concepts with statistical functions, and has optional AI Integration for social analysis of the asset using external data :
Supertrend: This indicator identifies the prevailing trend direction. A positive Supertrend value suggests an upward trend, while a negative value indicates a downward trend. The Palgo indicator utilizes a Supertrend with a customizable multiplier and a user-configurable Average True Range (ATR) length (defaulting to 21).
🛜Signal Generation Logic
The indicator generates buy and sell signals based on a calculated "final direction" value. This value is derived by combining the Supertrend direction and a modified RSI. The modification involves scaling the RSI output to a range of -0.5 to 0.5 and then further adjusting it.
The buy and sell conditions are as follows:
Buy Signal: A buy signal is triggered when the "final direction" crosses above a positive activation threshold while the current signal is not already bullish. Upon signal generation, a "Buy" label (colored green) appears below the bar, and initial Take Profit (TP) and Stop Loss (SL) levels are calculated and stored.
Sell Signal: Conversely, a sell signal is triggered when the "final direction" crosses below a negative activation threshold while the current signal is not already bearish. A "Sell" label (colored red) is plotted above the bar, and corresponding TP and SL levels are determined.
✅ Optimized Take-Profit / Stop-Loss
The Take-Profit (TP) & Stop-Loss (SL) signals are optimized with Kernel Density Estimation (KDE), the script uses KDE activated by gaussian function on previous pivot points and trains the model, then tries to estimate new pivot points early, to determine new TP / SL levels for the current signal. Kernel Density Estimation takes values of the previous confirmed pivots' RSI values, body size & more factors to determine their role. This indicator can generate up to 5 TP signals per signal.
📈 Signal Trail
Palgo also includes a "Signal Trail" that visually shows the market's momentum. This trail is like a dynamic line that follows the price.
When the market is in an uptrend and looking strong, you'll see a green trail.
When it's in a downtrend and looking weak, you'll see a red trail.
This trail helps you see if the market is currently aligned with Palgo's bullish (buy) or bearish (sell) signal. It also acts as a visual guide for potential support or resistance levels.
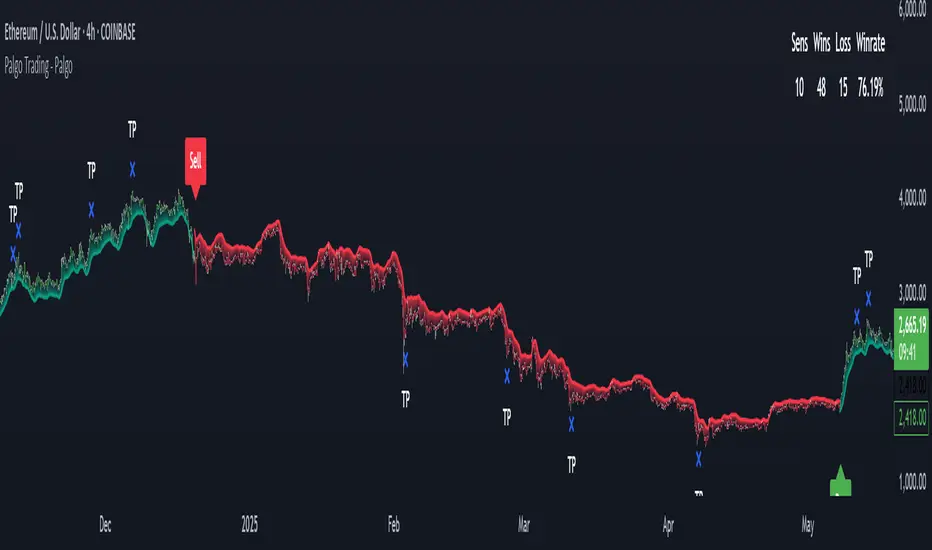
📊Backtesting Dashboard
The Palgo indicator includes an optional Backtesting Dashboard to help you understand its historical performance. This dashboard appears directly on your chart and provides a quick summary of how the indicator's signals have performed in the past.
Here's what you'll see on the dashboard:
Sensitivity: This shows the specific "Sensitivity" setting you've chosen for the indicator. This setting influences how often signals are generated.
Wins: This number tells you how many trades initiated by the Palgo indicator historically ended in profit (reached a Take-Profit target or closed profitably when the signal reversed).
Loss: This number indicates how many trades historically ended in a loss (hit the Stop-Loss).
Winrate: This is a very important metric, displayed as a percentage. It shows you the proportion of winning trades compared to the total number of trades (Wins / (Wins + Loss)). A higher winrate generally suggests a more effective strategy.
This dashboard is a valuable tool for reviewing the indicator's effectiveness with different settings and helping you make informed decisions about its use in your trading.
🤖AI Integration (Optional):
A unique feature of the Palgo indicator is the optional integration of Artificial Intelligence (AI) sentiment analysis. When the "Use AI" input is enabled, the indicator incorporates two additional user-defined inputs:
Impression Change %: This input represents the percentage change in overall market sentiment as assessed by an external AI.
Positivity Change: This input reflects the change in positive sentiment, also provided by an AI.
These AI inputs are combined to create an "AI Score," which then influences the "final direction" calculation. A positive AI Score amplifies the bullish signals and dampens bearish signals, while a negative AI Score has the opposite effect.
❓Why PALGO ?
All-in-One Analysis: Palgo combines trend, momentum, and advanced statistical analysis into one easy-to-use tool, giving you a complete picture without needing multiple indicators.
Dynamic Profit & Loss Management: Unlike many tools with fixed targets, Palgo's smart profit and stop-loss system adapts to the market using KDE. This helps you potentially capture more gains and limit losses effectively.
Optional AI Insights: For an extra edge, Palgo can tap into Artificial Intelligence (AI) to gauge overall market mood. If the AI sees a lot of positive buzz, it can strengthen buy signals; if it's negative, it can reinforce sell signals. This helps you trade with a better understanding of the market's pulse.
Clear and Customizable: Palgo is designed to be very visual. It changes the color of the price bars, adds clear "Buy" or "Sell" labels, and marks your profit and stop-loss points. You can also change the colors to suit your preference.
Palgo aims to be a comprehensive and adaptable trading tool, giving you clearer insights.
⚙️Visualizations and Customization
The Palgo indicator offers several visual cues to aid traders:
Bar Coloring: The price bars are colored green when the indicator identifies a bullish signal and red during a bearish signal.
Signal Labels: Clear "Buy" and "Sell" labels are plotted at the signal generation points.
Take Profit and Stop Loss Markers: Distinct shapes and labels indicate when the price reaches the calculated TP and SL levels.
Style Options: Users can customize the colors for bullish and bearish bars, text, and TP/SL markers within the indicator's settings.
Yalnızca davetli komut dosyası
Bu komut dosyasına yalnızca yazar tarafından onaylanan kullanıcılar erişebilir. Kullanmak için izin istemeniz ve almanız gerekir. Bu genellikle ödeme yapıldıktan sonra verilir. Daha fazla ayrıntı için aşağıdaki yazarın talimatlarını izleyin veya doğrudan PalgoTrading ile iletişime geçin.
TradingView, yazarına tamamen güvenmediğiniz ve nasıl çalıştığını anlamadığınız sürece bir komut dosyası için ödeme yapmanızı veya kullanmanızı TAVSİYE ETMEZ. Ayrıca topluluk komut dosyalarımızda ücretsiz, açık kaynaklı alternatifler bulabilirsiniz.
Yazarın talimatları
Feragatname
Yalnızca davetli komut dosyası
Bu komut dosyasına yalnızca yazar tarafından onaylanan kullanıcılar erişebilir. Kullanmak için izin istemeniz ve almanız gerekir. Bu genellikle ödeme yapıldıktan sonra verilir. Daha fazla ayrıntı için aşağıdaki yazarın talimatlarını izleyin veya doğrudan PalgoTrading ile iletişime geçin.
TradingView, yazarına tamamen güvenmediğiniz ve nasıl çalıştığını anlamadığınız sürece bir komut dosyası için ödeme yapmanızı veya kullanmanızı TAVSİYE ETMEZ. Ayrıca topluluk komut dosyalarımızda ücretsiz, açık kaynaklı alternatifler bulabilirsiniz.