OPEN-SOURCE SCRIPT
Mocker Market Mean Indicator
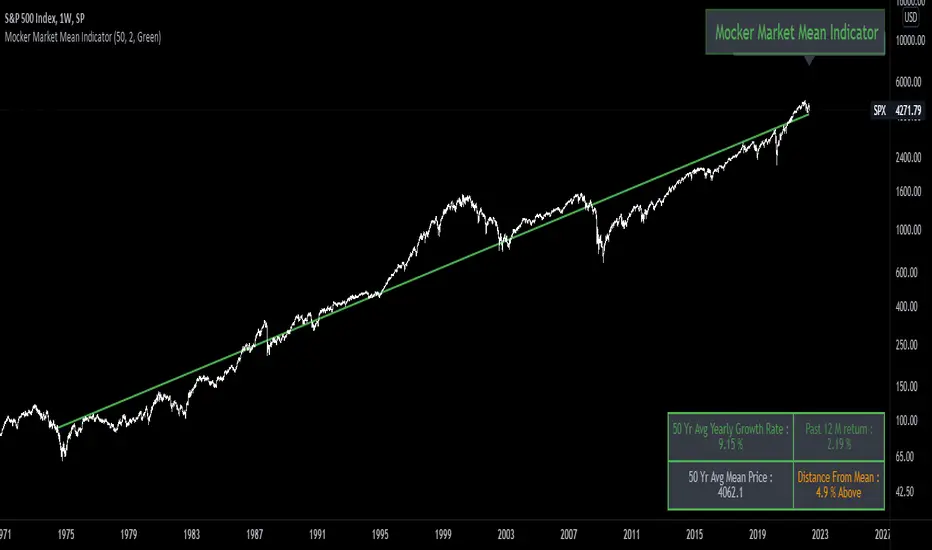
The objective of this indicator is to find the historical mean price of a market ( Intended for Indexes or ETF's). Based off of the concept that Benjamin Graham taught, that Mr. Market is a manic depressive forever oscillating between unjustified pessimism to extreme optimism. The intent of this indicator is to supplement a regular allocation strategy to an index or ETF , to increase that allocation when it's trading below its historical mean and decrease when trading above. It does this by using an exponential regression model to find the closest approximation of the current mean price based on past growth rate, and user defined lookback period.
Açık kaynak kodlu komut dosyası
Gerçek TradingView ruhuyla, bu komut dosyasının mimarı, yatırımcıların işlevselliğini inceleyip doğrulayabilmesi için onu açık kaynaklı hale getirdi. Yazarı tebrik ederiz! Ücretsiz olarak kullanabilseniz de, kodu yeniden yayınlamanın Topluluk Kurallarımıza tabi olduğunu unutmayın.
Feragatname
Bilgiler ve yayınlar, TradingView tarafından sağlanan veya onaylanan finansal, yatırım, alım satım veya diğer türden tavsiye veya öneriler anlamına gelmez ve teşkil etmez. Kullanım Koşulları bölümünde daha fazlasını okuyun.