OPEN-SOURCE SCRIPT
Güncellendi Relative Performance
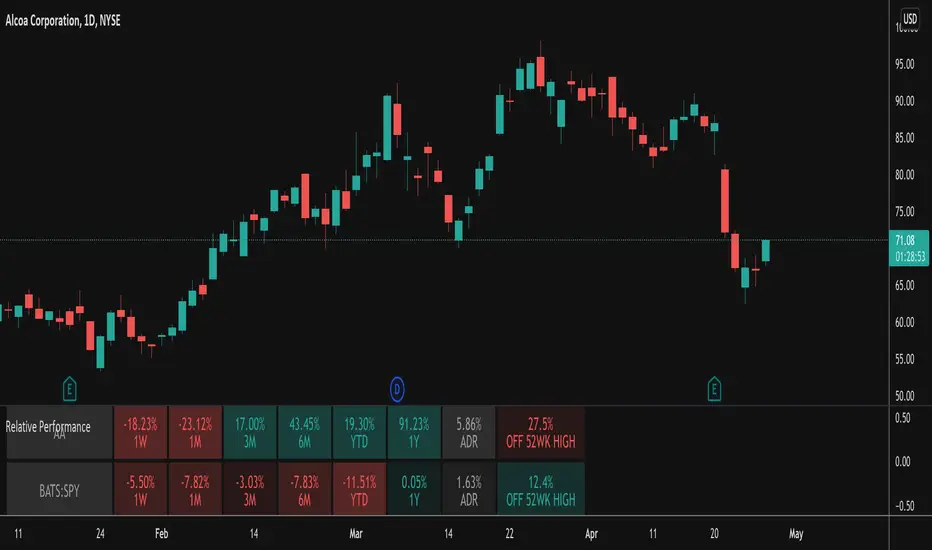
This indicator takes the Performance Table from BeeHolder and converts it to a Relative Performance table so you can compare the current chart vs. an Index (or whatever other ticker you want) to see the relative performance of one vs. the other. I also added a cell for ADR, which is also the same value as "Monthly Volatility" in the stock screener. This can be useful when screening stocks based on performance and volatility.
Sürüm Notları
Conversion to Pine v5Added a box to the table that looks at the distance from the 52 week high. The idea behind this is that the strongest stocks will be close to their highs and that's what you should focus on. I've coded it so that if a stock is within 25% of its 52 week high the color will be green indicating a good candidate.
Sürüm Notları
Changed the calculation for distance from the 52 week high to be the drawdown off the high instead of the percentage required to get back to the high as I think this is what people usually refer to when talking about this metric.Açık kaynak kodlu komut dosyası
Gerçek TradingView ruhuyla, bu komut dosyasının mimarı, yatırımcıların işlevselliğini inceleyip doğrulayabilmesi için onu açık kaynaklı hale getirdi. Yazarı tebrik ederiz! Ücretsiz olarak kullanabilseniz de, kodu yeniden yayınlamanın Topluluk Kurallarımıza tabi olduğunu unutmayın.
Feragatname
Bilgiler ve yayınlar, TradingView tarafından sağlanan veya onaylanan finansal, yatırım, alım satım veya diğer türden tavsiye veya öneriler anlamına gelmez ve teşkil etmez. Kullanım Koşulları bölümünde daha fazlasını okuyun.
Açık kaynak kodlu komut dosyası
Gerçek TradingView ruhuyla, bu komut dosyasının mimarı, yatırımcıların işlevselliğini inceleyip doğrulayabilmesi için onu açık kaynaklı hale getirdi. Yazarı tebrik ederiz! Ücretsiz olarak kullanabilseniz de, kodu yeniden yayınlamanın Topluluk Kurallarımıza tabi olduğunu unutmayın.
Feragatname
Bilgiler ve yayınlar, TradingView tarafından sağlanan veya onaylanan finansal, yatırım, alım satım veya diğer türden tavsiye veya öneriler anlamına gelmez ve teşkil etmez. Kullanım Koşulları bölümünde daha fazlasını okuyun.