OPEN-SOURCE SCRIPT
Güncellendi Enhanced Trix
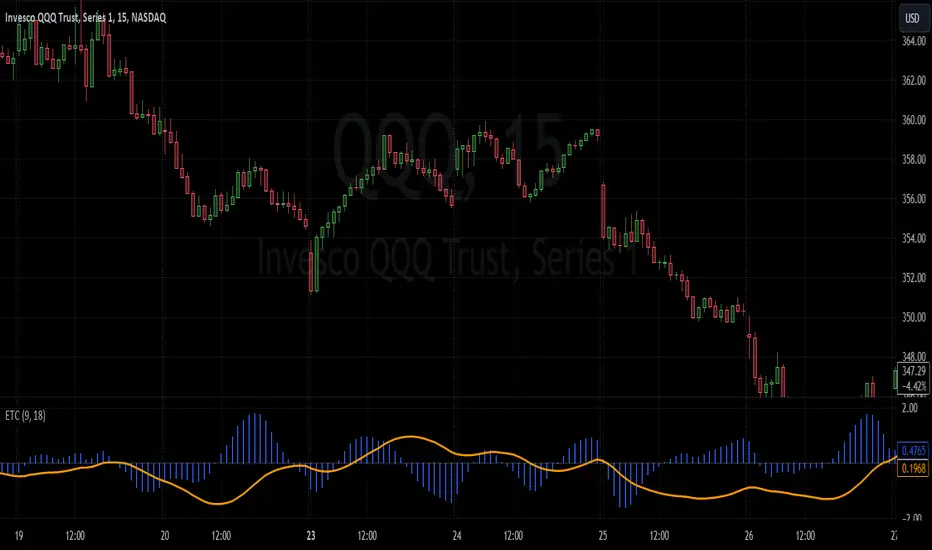
The Enhanced Trix Confluence Oscillator involves utilizing two core components: a slow line and a difference histogram based on a shorter length. Another key aspect is the indicator using the DEMA for greater speed while the triple smoothing still provides accuracy which makes this different from the original indicator. This approach aims to rely on principles of both momentum and divergence.
The ETC aims to filter out market noise to reveal the core trend direction in both the short and medium term. A slow line is calculated using a longer time period with the double exponential moving average, which makes it less responsive to short-term price fluctuations and better at capturing longer-term momentum. It's best used to identify divergences with the asset's price, signaling potential reversals. The difference histogram serves as a more sensitive indicator for trade timing once further calibrated. It's calculated by taking the difference between the displayed length and a shorter period using the same calculation. This histogram also operates as a rate of change like the TRIX.
The ETC aims to filter out market noise to reveal the core trend direction in both the short and medium term. A slow line is calculated using a longer time period with the double exponential moving average, which makes it less responsive to short-term price fluctuations and better at capturing longer-term momentum. It's best used to identify divergences with the asset's price, signaling potential reversals. The difference histogram serves as a more sensitive indicator for trade timing once further calibrated. It's calculated by taking the difference between the displayed length and a shorter period using the same calculation. This histogram also operates as a rate of change like the TRIX.
- The slow line identifies broader trends and divergences, while the difference histogram offers a more granular view.
Sürüm Notları
Upon experimentation decided to utilize the ALMA as the shorter length for the difference oscillator with the option to customize the offset to adjust the gaussian based result in the plotting, a higher offset speeds up the bell curve and vice versa.Açık kaynak kodlu komut dosyası
Gerçek TradingView ruhuyla, bu komut dosyasının mimarı, yatırımcıların işlevselliğini inceleyip doğrulayabilmesi için onu açık kaynaklı hale getirdi. Yazarı tebrik ederiz! Ücretsiz olarak kullanabilseniz de, kodu yeniden yayınlamanın Topluluk Kurallarımıza tabi olduğunu unutmayın.
KP
Feragatname
Bilgiler ve yayınlar, TradingView tarafından sağlanan veya onaylanan finansal, yatırım, alım satım veya diğer türden tavsiye veya öneriler anlamına gelmez ve teşkil etmez. Kullanım Koşulları bölümünde daha fazlasını okuyun.
Açık kaynak kodlu komut dosyası
Gerçek TradingView ruhuyla, bu komut dosyasının mimarı, yatırımcıların işlevselliğini inceleyip doğrulayabilmesi için onu açık kaynaklı hale getirdi. Yazarı tebrik ederiz! Ücretsiz olarak kullanabilseniz de, kodu yeniden yayınlamanın Topluluk Kurallarımıza tabi olduğunu unutmayın.
KP
Feragatname
Bilgiler ve yayınlar, TradingView tarafından sağlanan veya onaylanan finansal, yatırım, alım satım veya diğer türden tavsiye veya öneriler anlamına gelmez ve teşkil etmez. Kullanım Koşulları bölümünde daha fazlasını okuyun.