OPEN-SOURCE SCRIPT
WaveTrend and Crossing EMA of RSIs by Alhazen
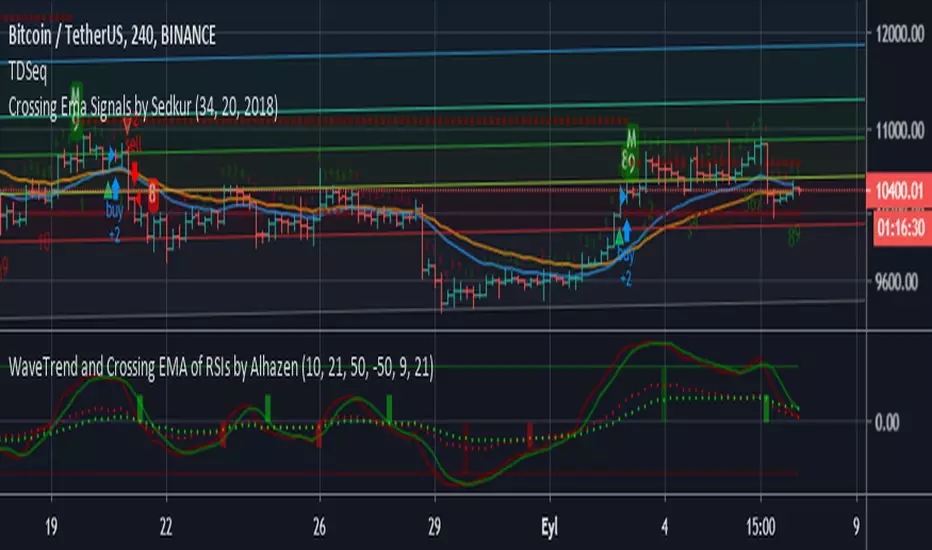
LazyBear's WaveTrend Oscilator is simplified, and buy & sell signals are added. Green bars indicate SELL signal of WT, and Maroon bars indicate BUY signal of WT.
A new indicator added: Crossing EMA of two RSI's. RSI plots are shown with dotted lines. Lime bars indicate SELL signal of RSI, and Red bars indicate BUY signal of RSI.
You can combine WT and RSI together and decide to BUY or SELL.
A new indicator added: Crossing EMA of two RSI's. RSI plots are shown with dotted lines. Lime bars indicate SELL signal of RSI, and Red bars indicate BUY signal of RSI.
You can combine WT and RSI together and decide to BUY or SELL.
Açık kaynak kodlu komut dosyası
Gerçek TradingView ruhuna uygun olarak, bu komut dosyasının oluşturucusu bunu açık kaynaklı hale getirmiştir, böylece yatırımcılar betiğin işlevselliğini inceleyip doğrulayabilir. Yazara saygı! Ücretsiz olarak kullanabilirsiniz, ancak kodu yeniden yayınlamanın Site Kurallarımıza tabi olduğunu unutmayın.
Feragatname
Bilgiler ve yayınlar, TradingView tarafından sağlanan veya onaylanan finansal, yatırım, işlem veya diğer türden tavsiye veya tavsiyeler anlamına gelmez ve teşkil etmez. Kullanım Şartları'nda daha fazlasını okuyun.