OPEN-SOURCE SCRIPT
Güncellendi StockInfo Manual

Script Description:
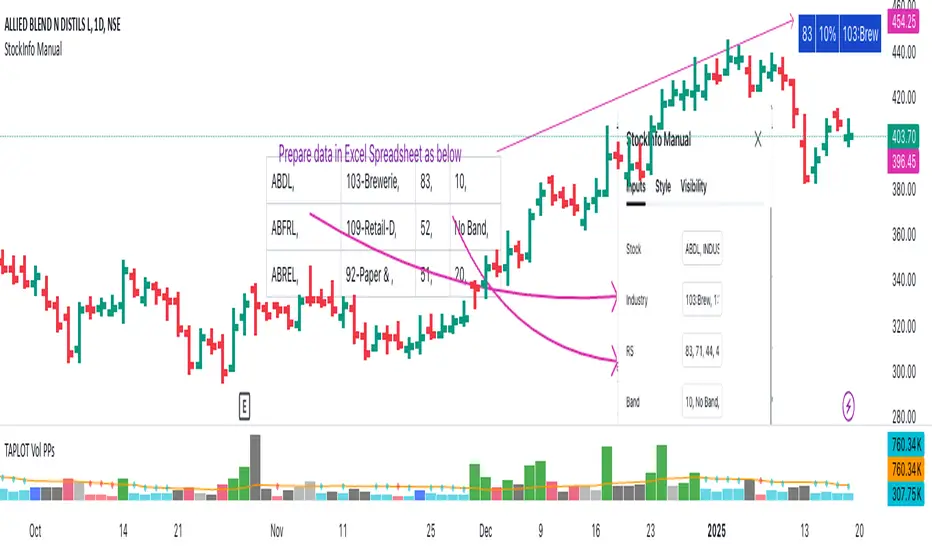
The StockInfo Manual is designed to display detailed stock information directly on the chart for the selected symbol. It processes user-provided input data, including
Key Features:
1. Symbol-Specific Data Display: Displays information only for the current chart symbol.
2. Customizable Table: Adjust the table's position, text size, colors, and headers to match your preferences.
3. Low RS/Band Conditions: Highlights critical metrics (RS < 50 or Band < 6) with a red background for quick visual cues.
4. Toggle Information: Choose to show or hide RS, Band, and Industry columns based on your needs.
How to Use the Script:
1. Use any platform (ex: chartsmaze) to get Industry,RS and Band information of any Stock. Prepare the data as separate column of excel
2. Configure Inputs:
- Stock Symbols (`Stock`): Enter a comma-separated list of stock symbols (e.g.,
NSE:ABDL,
NSE:ABFRL,
NSE:ABREL,
NSE:ABSLAMC,
NSE:ACC,
NSE:ACE,
- Industries (`Industry`): Provide a comma-separated list of industries for the stocks (e.g., 103-Brewerie,
109-Retail-D,
92-Paper & ,
19-Asset Ma,
62-Cement,
58-Industri,
- Relative Strength (`RS`): Input RS values for each stock (e.g.,
83,
52,
51,
81,
23,
59,
- Band Information (`Band`): Specify Band values for each stock. Use "No Band" if 10,
No Band,
20,
20,
No Band,
20,
3. Customize the Table:
-Display Options: Toggle the visibility of `RS`, `Band`, and `Industry` using the input checkboxes.
-Position and Appearance: Choose the table's position on the chart (e.g., top-right, bottom-center). Customize text size, background colors, header display, and other visual elements.
4. Interpret the Table:
- The table will dynamically display information for the current chart symbol only.
- If the `RS` is below 50 or the Band is below 6, the corresponding row is highlighted with a red background for immediate attention.
One need to enter details at least weekly for a correct result
The StockInfo Manual is designed to display detailed stock information directly on the chart for the selected symbol. It processes user-provided input data, including
- stock symbols
- Industries
- Relative Strength (RS) values
- Band information
Key Features:
1. Symbol-Specific Data Display: Displays information only for the current chart symbol.
2. Customizable Table: Adjust the table's position, text size, colors, and headers to match your preferences.
3. Low RS/Band Conditions: Highlights critical metrics (RS < 50 or Band < 6) with a red background for quick visual cues.
4. Toggle Information: Choose to show or hide RS, Band, and Industry columns based on your needs.
How to Use the Script:
1. Use any platform (ex: chartsmaze) to get Industry,RS and Band information of any Stock. Prepare the data as separate column of excel
2. Configure Inputs:
- Stock Symbols (`Stock`): Enter a comma-separated list of stock symbols (e.g.,
NSE:ABDL,
NSE:ABFRL,
NSE:ABREL,
NSE:ABSLAMC,
NSE:ACC,
NSE:ACE,
- Industries (`Industry`): Provide a comma-separated list of industries for the stocks (e.g., 103-Brewerie,
109-Retail-D,
92-Paper & ,
19-Asset Ma,
62-Cement,
58-Industri,
- Relative Strength (`RS`): Input RS values for each stock (e.g.,
83,
52,
51,
81,
23,
59,
- Band Information (`Band`): Specify Band values for each stock. Use "No Band" if 10,
No Band,
20,
20,
No Band,
20,
3. Customize the Table:
-Display Options: Toggle the visibility of `RS`, `Band`, and `Industry` using the input checkboxes.
-Position and Appearance: Choose the table's position on the chart (e.g., top-right, bottom-center). Customize text size, background colors, header display, and other visual elements.
4. Interpret the Table:
- The table will dynamically display information for the current chart symbol only.
- If the `RS` is below 50 or the Band is below 6, the corresponding row is highlighted with a red background for immediate attention.
One need to enter details at least weekly for a correct result
Sürüm Notları
Show the number of records displayed. Around 450 symbols can be displayed because of size limitationsSürüm Notları
Minor Change:1) Provide the header name
Sürüm Notları
Minor changeAçık kaynak kodlu komut dosyası
Gerçek TradingView ruhuyla, bu komut dosyasının mimarı, yatırımcıların işlevselliğini inceleyip doğrulayabilmesi için onu açık kaynaklı hale getirdi. Yazarı tebrik ederiz! Ücretsiz olarak kullanabilseniz de, kodu yeniden yayınlamanın Topluluk Kurallarımıza tabi olduğunu unutmayın.
Feragatname
Bilgiler ve yayınlar, TradingView tarafından sağlanan veya onaylanan finansal, yatırım, alım satım veya diğer türden tavsiye veya öneriler anlamına gelmez ve teşkil etmez. Kullanım Koşulları bölümünde daha fazlasını okuyun.
Açık kaynak kodlu komut dosyası
Gerçek TradingView ruhuyla, bu komut dosyasının mimarı, yatırımcıların işlevselliğini inceleyip doğrulayabilmesi için onu açık kaynaklı hale getirdi. Yazarı tebrik ederiz! Ücretsiz olarak kullanabilseniz de, kodu yeniden yayınlamanın Topluluk Kurallarımıza tabi olduğunu unutmayın.
Feragatname
Bilgiler ve yayınlar, TradingView tarafından sağlanan veya onaylanan finansal, yatırım, alım satım veya diğer türden tavsiye veya öneriler anlamına gelmez ve teşkil etmez. Kullanım Koşulları bölümünde daha fazlasını okuyun.