OPEN-SOURCE SCRIPT
HPDR Bands Indicator

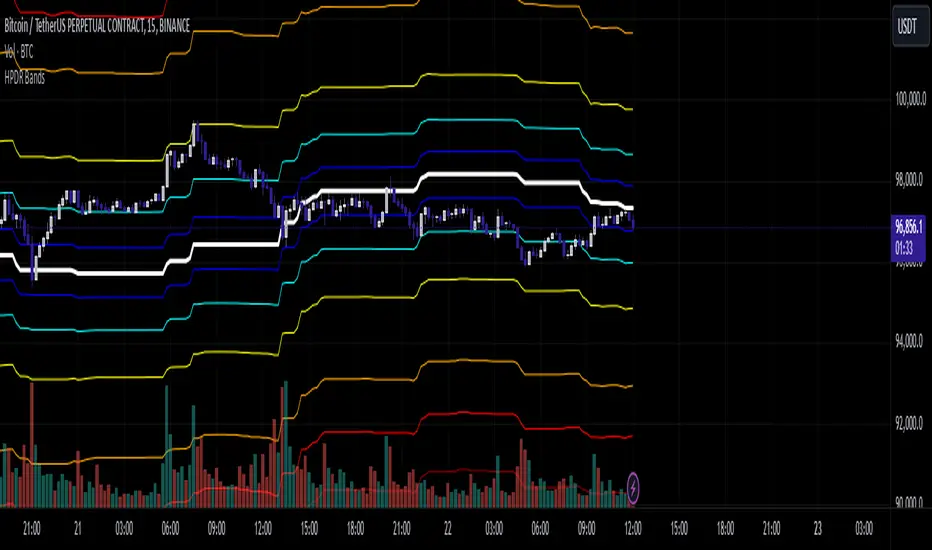
The HPDR Bands indicator is a customizable tool designed to help traders visualize dynamic price action zones. By combining historical price ranges with adaptive bands, this script provides clear insights into potential support, resistance, and midline levels. The indicator is well-suited for all trading styles, including trend-following and range-bound strategies.
Features:
How to Use:
Important Notes:
This script is not intended as investment advice. It is a tool to assist with market analysis and should be used alongside proper risk management and other trading tools.
The script is provided as-is and without warranty. Users are encouraged to backtest and validate its suitability for their specific trading needs.
Happy Trading!
If you find this script helpful, consider sharing your feedback or suggestions for improvement. Collaboration strengthens the TradingView community, and your input is always appreciated!
Features:
- Dynamic Price Bands: Calculates price zones based on historical highs and lows, blending long-term and short-term price data for responsive adaptation to current market conditions.
- Probability Enhancements: Includes a probability plot derived from the relative position of the closing price within the range, adjusted for volatility to highlight potential price movement scenarios.
- Fibonacci-Like Levels: Highlights key levels (100%, 95%, 88%, 78%, 61%, 50%, and 38%) for intuitive visualization of price zones, aiding in identifying high-probability trading opportunities.
- Midline Visualization: Displays a midline that serves as a reference for price mean reversion or breakout analysis.
How to Use:
- Trending Markets: Use the adaptive upper and lower bands to gauge potential breakout or retracement zones.
- Range-Bound Markets: Identify support and resistance levels within the defined price range.
- Volatility Analysis: Observe the probability plot and its sensitivity to volatility for informed decision-making.
Important Notes:
This script is not intended as investment advice. It is a tool to assist with market analysis and should be used alongside proper risk management and other trading tools.
The script is provided as-is and without warranty. Users are encouraged to backtest and validate its suitability for their specific trading needs.
Happy Trading!
If you find this script helpful, consider sharing your feedback or suggestions for improvement. Collaboration strengthens the TradingView community, and your input is always appreciated!
Açık kaynak kodlu komut dosyası
Gerçek TradingView ruhuyla, bu komut dosyasının mimarı, yatırımcıların işlevselliğini inceleyip doğrulayabilmesi için onu açık kaynaklı hale getirdi. Yazarı tebrik ederiz! Ücretsiz olarak kullanabilseniz de, kodu yeniden yayınlamanın Topluluk Kurallarımıza tabi olduğunu unutmayın.
Feragatname
Bilgiler ve yayınlar, TradingView tarafından sağlanan veya onaylanan finansal, yatırım, alım satım veya diğer türden tavsiye veya öneriler anlamına gelmez ve teşkil etmez. Kullanım Koşulları bölümünde daha fazlasını okuyun.