OPEN-SOURCE SCRIPT
Güncellendi TrianglePoint strategy
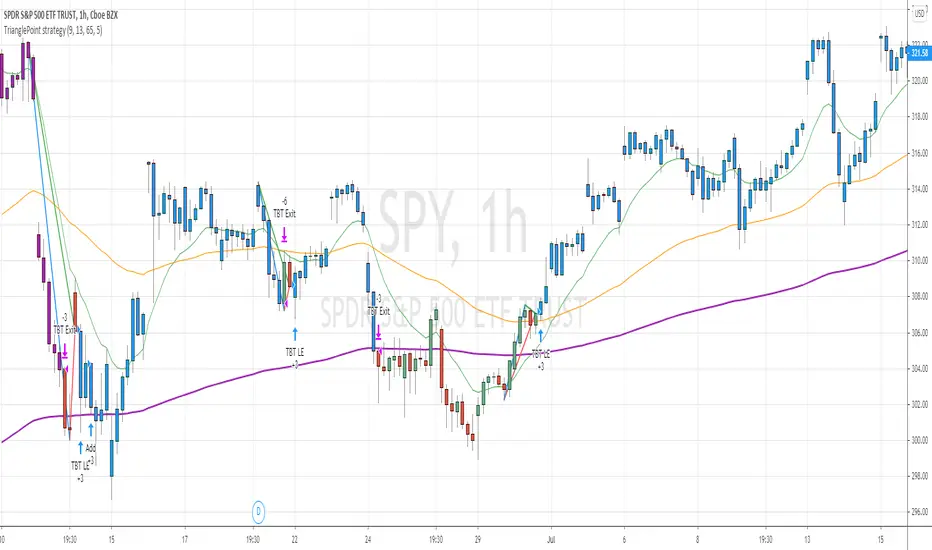
This is trend following strategy ... when price is trading well above 200 ema and forms a triangle (based on number of bars defined)
BUY
====
when fast ema > 200 ema
check for triangle of last N bars (default set to 9)
EXIT
======
when fast ema crosses down middle term ema
if price reaches above 5% of buy , it changes the color to purple. You can close any time or wait for above signal.
STOP LOSS
=======
stop loss default value set to 5%
Note: No triangle shown on the chart. I will find out how to add the lines to the chart.
Warning
=========
For the use of educational purposes only
Sürüm Notları
I have added Triangle drawings to the chart.Also I have noticed that when position is taken LONG, mostly price reaches the half of the height of the Triangle. You can lock profits there or raise the stop loss ....
if the price goes south (downwards) half of the height of the triangle , you can wind up the position rather than waiting for defined 5% loss
Açık kaynak kodlu komut dosyası
Gerçek TradingView ruhuyla, bu komut dosyasının mimarı, yatırımcıların işlevselliğini inceleyip doğrulayabilmesi için onu açık kaynaklı hale getirdi. Yazarı tebrik ederiz! Ücretsiz olarak kullanabilseniz de, kodu yeniden yayınlamanın Topluluk Kurallarımıza tabi olduğunu unutmayın.
Feragatname
Bilgiler ve yayınlar, TradingView tarafından sağlanan veya onaylanan finansal, yatırım, alım satım veya diğer türden tavsiye veya öneriler anlamına gelmez ve teşkil etmez. Kullanım Koşulları bölümünde daha fazlasını okuyun.