OPEN-SOURCE SCRIPT
Güncellendi Up/Down Volume Ratio
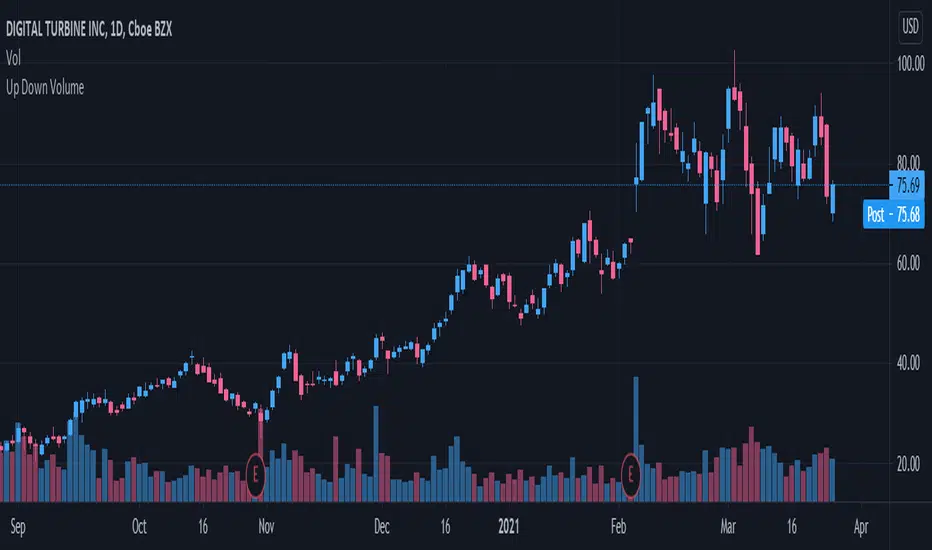
Up/Down Volume Ratio is calculated by summing volume on days when it closes up and divide that total by the volume on days when the stock closed down.
High volume up days are typically a sign of accumulation(buying) by big players, while down days are signs of distribution(selling) by big market players. The Up Down volume ratio takes this assumption and turns it into a tangible number that's easier for the trader to understand. My formula is calculated using the past 50 periods, be warned it will not display a value for stocks with under 50 periods of trading history. This indicator is great for identify accumulation of growth stocks early on in their moves, most of the time you would like a growth stocks U/D value to be above 2, showing institutional sponsorship of a stock.
Up/Down Volume value interpretation:
U/D < 1 -> Bearish outlook, as sellers are in control
U/D = 1 -> Sellers and Buyers are equal
U/D > 1 -> Bullish outlook, as buyers are in control
U/D > 2 -> Bullish outlook, significant accumulation underway by market makers
U/D >= 3 -> MONSTER STOCK ALERT, market makers can not get enough of this stock and are ravenous to buy more
U/D values greater than 2 are rare and typically do not last very long, and U/D >= 3 are extremely rare one example I kind find of a stock's U/D peaking above 3 was Google back in 2005.
MAKE SURE TO HIT THE SETTINGS WHEEL AND CHECK THE BOX NEXT TO PLOT IN ORDER TO GET RID OF THE PLOTTED LINE.
Sürüm Notları
No more need to disable plot!Açık kaynak kodlu komut dosyası
Gerçek TradingView ruhuyla, bu komut dosyasının mimarı, yatırımcıların işlevselliğini inceleyip doğrulayabilmesi için onu açık kaynaklı hale getirdi. Yazarı tebrik ederiz! Ücretsiz olarak kullanabilseniz de, kodu yeniden yayınlamanın Topluluk Kurallarımıza tabi olduğunu unutmayın.
Feragatname
Bilgiler ve yayınlar, TradingView tarafından sağlanan veya onaylanan finansal, yatırım, alım satım veya diğer türden tavsiye veya öneriler anlamına gelmez ve teşkil etmez. Kullanım Koşulları bölümünde daha fazlasını okuyun.
Açık kaynak kodlu komut dosyası
Gerçek TradingView ruhuyla, bu komut dosyasının mimarı, yatırımcıların işlevselliğini inceleyip doğrulayabilmesi için onu açık kaynaklı hale getirdi. Yazarı tebrik ederiz! Ücretsiz olarak kullanabilseniz de, kodu yeniden yayınlamanın Topluluk Kurallarımıza tabi olduğunu unutmayın.
Feragatname
Bilgiler ve yayınlar, TradingView tarafından sağlanan veya onaylanan finansal, yatırım, alım satım veya diğer türden tavsiye veya öneriler anlamına gelmez ve teşkil etmez. Kullanım Koşulları bölümünde daha fazlasını okuyun.