OPEN-SOURCE SCRIPT
Percentage MACD Enhanced 3
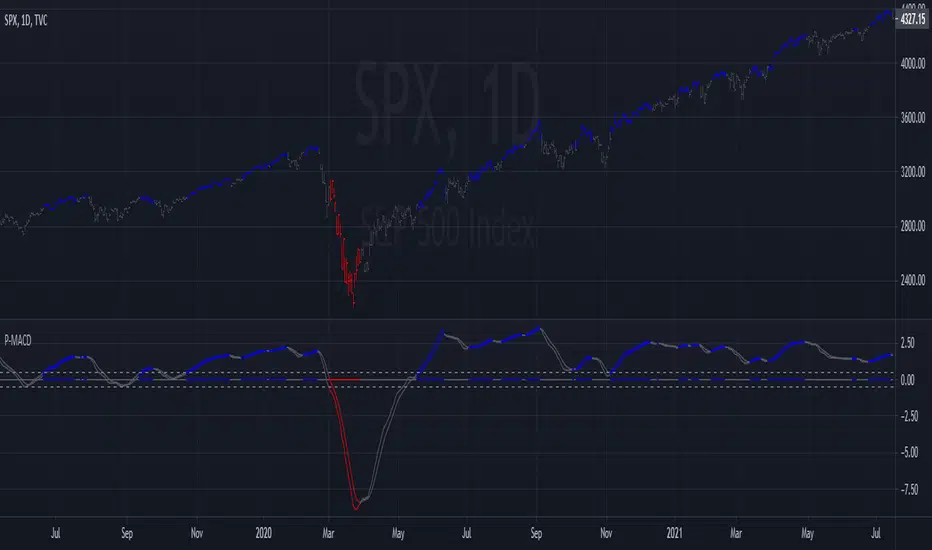
This MACD is calculated using percentage above or below the zero line for consistency and compatibility across different stocks and markets. The price bars are colored when MACD is above/below extreme levels and crossed in that direction. The intention is to use this setting on a longer time frame and trade only in the direction the bars are colored. This setting is also a powerful way to take profits! As usual, my scripts are public for scrutiny and to adjust for your personal needs.
Açık kaynak kodlu komut dosyası
Gerçek TradingView ruhuyla, bu komut dosyasının mimarı, yatırımcıların işlevselliğini inceleyip doğrulayabilmesi için onu açık kaynaklı hale getirdi. Yazarı tebrik ederiz! Ücretsiz olarak kullanabilseniz de, kodu yeniden yayınlamanın Topluluk Kurallarımıza tabi olduğunu unutmayın.
Feragatname
Bilgiler ve yayınlar, TradingView tarafından sağlanan veya onaylanan finansal, yatırım, alım satım veya diğer türden tavsiye veya öneriler anlamına gelmez ve teşkil etmez. Kullanım Koşulları bölümünde daha fazlasını okuyun.