OPEN-SOURCE SCRIPT
[RS] MTF Murrey's Math Lines Channel
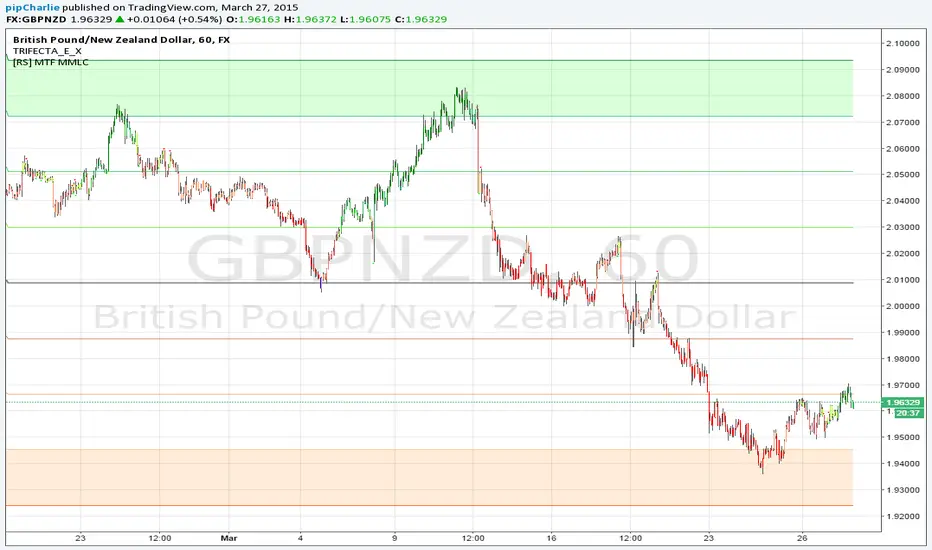
Took the orginal Murrey's Math Lines Channel and added Multi Timeframe functionality.
Question though, how do I get 4H available in the drop down list when setting the desired timeframe ?
Thanks
Question though, how do I get 4H available in the drop down list when setting the desired timeframe ?
Thanks
Açık kaynak kodlu komut dosyası
Gerçek TradingView ruhuyla, bu komut dosyasının yaratıcısı, yatırımcıların işlevselliğini inceleyip doğrulayabilmesi için onu açık kaynaklı hale getirdi. Yazarı tebrik ederiz! Ücretsiz olarak kullanabilseniz de, kodu yeniden yayınlamanın Topluluk Kurallarımıza tabi olduğunu unutmayın.
Feragatname
Bilgiler ve yayınlar, TradingView tarafından sağlanan veya onaylanan finansal, yatırım, alım satım veya diğer türden tavsiye veya öneriler anlamına gelmez ve teşkil etmez. Kullanım Koşulları bölümünde daha fazlasını okuyun.