OPEN-SOURCE SCRIPT
Value of my asset
Indicator Name: Value of my asset
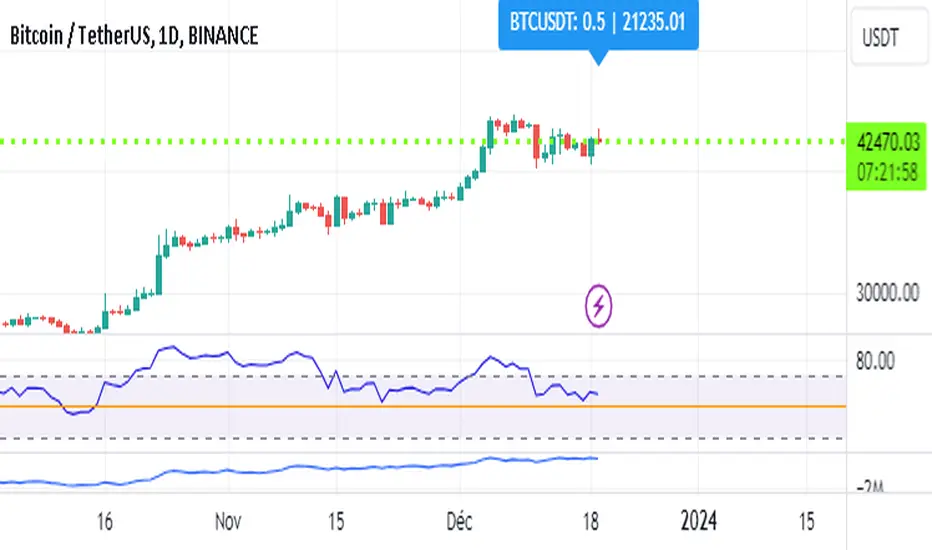
This indicator displays the total value of the asset you hold on a chart. It is particularly useful for tracking the value of your position in real time directly on the chart.
How to use it:
Quantity of the asset in possession: Enter the quantity of the asset you currently hold. By default, this value is 0.
Text color: Choose the color of the text that will be displayed on the chart. By default, this color is white.
Background color: Choose the background color of the label that will be displayed on the chart. By default, this color is blue.
Calculation of the value to display: The value to display is calculated by multiplying the closing value (close) by the quantity of the asset you hold (quantity). This value represents the total value of your position.
Display of the label: A label is displayed on the chart with the symbol of the asset, the quantity you hold, and the total value of your position. This label is updated with each new bar.
Açık kaynak kodlu komut dosyası
Gerçek TradingView ruhuyla, bu komut dosyasının mimarı, yatırımcıların işlevselliğini inceleyip doğrulayabilmesi için onu açık kaynaklı hale getirdi. Yazarı tebrik ederiz! Ücretsiz olarak kullanabilseniz de, kodu yeniden yayınlamanın Topluluk Kurallarımıza tabi olduğunu unutmayın.
Feragatname
Bilgiler ve yayınlar, TradingView tarafından sağlanan veya onaylanan finansal, yatırım, alım satım veya diğer türden tavsiye veya öneriler anlamına gelmez ve teşkil etmez. Kullanım Koşulları bölümünde daha fazlasını okuyun.